Abstract
Stock markets are volatile environments in which there is wild fluctuation. This project explores the notion of "anomaly" within the market. Stock returns for the Dow Jones Industrial Average and its components are aggregated as a function of time. This signal is transformed into an anomaly curve by utilizing previous time points to examine the probability that a current time point arose from the distribution of prior time points (estimated by kernel density estimate). Statistical analysis and visualization were performed to assess the relation of volatility and return on anomaly as well as inter-anomaly correlation. The notion of systemic anomaly is also explored.
Methods
A Visual Demonstration of Anomaly Detection via RarerProbability and KDE in LearnDistribution
Suppose we have random variable $x$ and we wish to identify if point $z$ would be considered anomalous under $x$.
The first step would be to consider the distribution of points $x$. Suppose the sample yields the following:
x = {5,5,5,4,4,6,3,14,14,14,13,13,12,11,15,15}
The distribution of $x$ can be empirically learned/estimated through a kernel density estimation, which smooths out the points by superimposing kernels of certain bandwidths about each point to ultimately create an estimate of the probability distribution of the random variate $x$.
Formally, the $\mathrm{PDF}(x)$ for KDE using a Gaussian kernel on a set of observations $\hat{x}$ is given by $\frac{1}{m h} \sum_{i=1}^{m}$ ${k (\frac{\hat{x}-x_i}{h}) }$ with kernel function $k(u)=\frac{1}{\sqrt{2\pi}}\mathbb{e}^{-\frac{u^2}{2h^2}}$, kernel size $h$ and number of training samples $m$
Once the distribution is learned, anomaly scores can be assigned using the RarerProbability function.
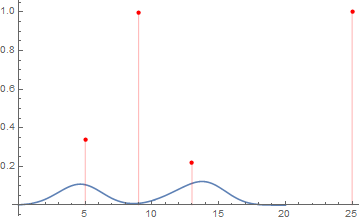
Here is a plot of anomaly probability with the PDF of the KDE
ld = LearnDistribution[x, Method -> "KernelDensityEstimation", FeatureExtractor -> "Minimal"]
Show[Plot[PDF[ld, x], {x, 0, 20}],
 ListPlot[{#, 1 - RarerProbability[ld, #]} & /@ {9, 25, 13, 5},
  PlotStyle -> Red, Filling -> Axis], PlotRange -> All]
Anomaly Detection for Time Series Data
In order to detect anomalies across a time series I defined the following two functions:
tsw2AnomalProb[ts_,t_]:=
  Module[{tr,an,ad},
{tr,an}= TakeDrop[ts,t];
SeedRandom[0];
ad = LearnDistribution[tr,RandomSeeding->0,Method->"KernelDensityEstimation",
                 TimeGoal->1,TrainingProgressReporting->None];
1-RarerProbability[ad,an] (* Higher quantities are more anomalous*)
]
This time series to anomaly probability function only operates on a window of a time series. In order to convert entire time series, this function must be applied over each sub-window of the time series, starting at the beginning and moving over one each time.
ts2AnomalProb[ts_,t_,window_]:=
   Module[{out},
     Print["abc called ts2AnomalProb"];
     out = tsw2AnomalProb[#,t]&/@Partition[ts["Values"],window,window-t]//Flatten;
     TimeSeries[Transpose[{ts["Dates"],PadLeft[out,ts["PathLength"]]}]]
   ]
I ran these two functions across all the components of the Dow Jones. Anomaly and stock return data is provided in the attached notebook.
Results
Visualizing the Return and Anomaly Signals Together
mergeOnColor[ts_,colorTs_]:= Style@@@Transpose[{ts["Values"],
                             Blend[{Yellow,Red},#]&/@colorTs["Values"]}]
Here is the combination of the anomaly probability (color, yellow is non-anomalous, red is anomalous) and the return on a given stock. The red points on the left are due to padding. 
Visualizing the Anomaly Signal
Here's a moving average over the anomaly signals. 
Examining Systemic Anomaly
Let's see if there is any relation between the different stock anomaly signals. For the most part, they don't seem to be highly correlated, though there are some bands in which anomalies seem to occur together.
Let's first visualize the anomaly time series:
(anomalData =
   Transpose[
    Map[Drop[#, 20] &, #["Values"] & /@ Values[anomalTs], {1}]]) //
 MatrixPlot[Transpose[#], ImageSize -> Large] &
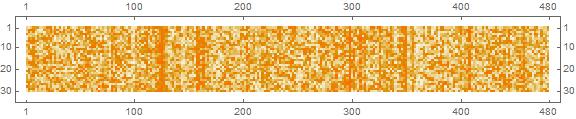
Now I count the number of anomalies by day and segment the data accordingly, finding the ones with greater than 20 anomalous stocks a day and those with under 10 anomalous stocks a day.
anomalCounts = Count[#, _?(# > .5 &)] & /@ anomalData
posGreater20 = Position[anomalCounts, _?(# >= 20 &)] // Flatten
posLess10 = Position[anomalCounts, _?(# <= 10 &)] // Flatten
ListPlot[anomalCounts,
 Prolog -> {{LightRed, Rectangle[{0, 19.5`}, {500, 35}]}, {LightBlue,
    Rectangle[{0, 10.5`}, {500, 19.5`}]}, {LightOrange,
    Rectangle[{0, 0}, {500, 10.5`}]}}, ImageSize -> Large,
 PlotStyle -> Directive[Gray, Opacity[1]],
 PlotMarkers -> {Automatic, 8}]
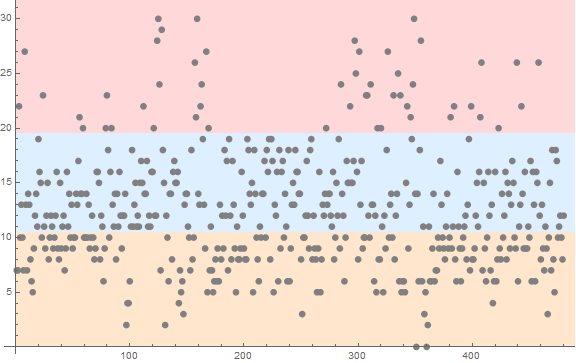
Interestingly, the average over the Dow Jones return for those stocks with $\geq 20$ anomalous stocks is down $-0.370067\%$ while those with $\leq 10$ stocks anomalous is $0.110058\%$ What this means that when more than $\frac{20}{30}$stocks are anomalous ( $\mathrm{P(anomaly)}\geq.5$ ), it turns out that those days the Dow Jones is down, while when there are less than $\frac{10}{30}$stocks the Dow Jones is up. This hints at a systemic origin of anomaly as when anomalies occur together the stock market is generally down even though, individually, the probability of anomaly is relatively uniform. 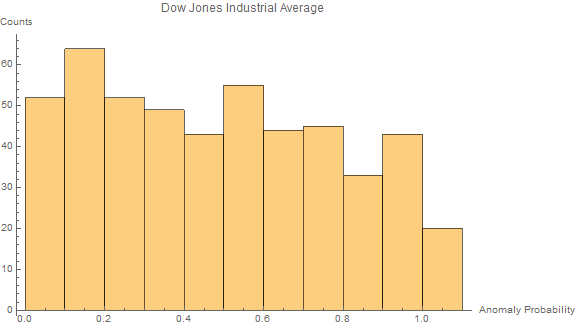
Examining Anomaly Probability Together
I examined systemic anomaly by also inputting all components of the Dow for a certain interval into the anomaly detection simultaneously.
tsw2anomalProbMultiDim[ts_]:=
Module[{tr,an},
{tr,an} = TakeDrop[ts,Length[ts]-1];
RarerProbability[LearnDistribution[tr//Flatten,Method->"KernelDensityEstimation",TrainingProgressReporting->"SimplePanel"],an//Flatten]
]
anomalTogether =
 tsw2anomalProbMultiDim /@
  Partition[Transpose[Normal[#["Values"]] & /@ Values[stockTs]],
   windowSize, 1
Here is a correlation matrix plot for the return correlations, the individual anomalies and systemic anomaly probabilities respectively, with the first row/column being the Dow Jones. Notice here that returns are relatively correlated, while the individual anomalies are all rather independent. However, on the systemic anomalies, the index (Dow Jones) anomalies appears to be highly correlated with the anomalies of each the individual components, indicating a systemic but non-pairwise risk. 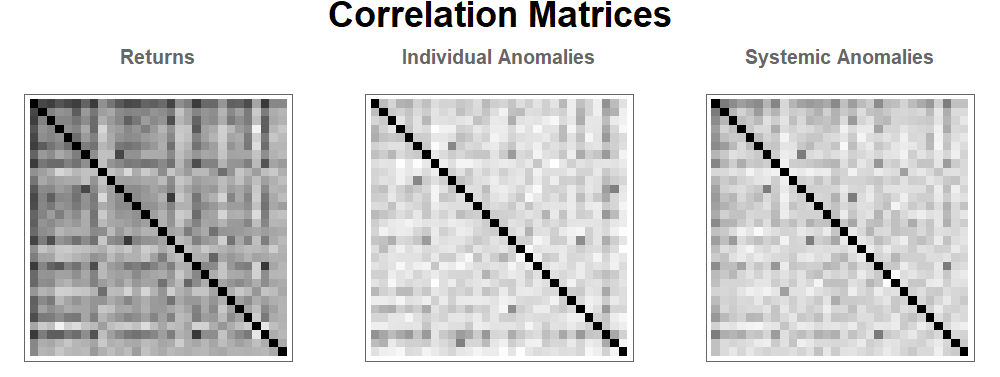
Examining Anomaly and Return
Here is a plot of the anomaly probability against return percentages. 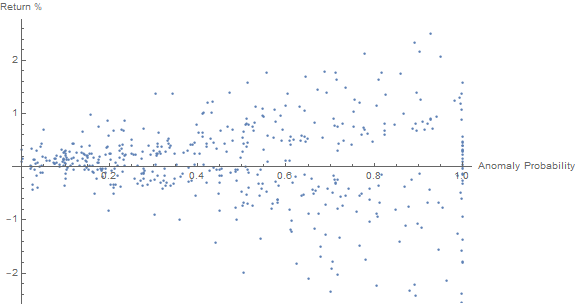
And this is a plot of the anomaly probability against next day return percentages.
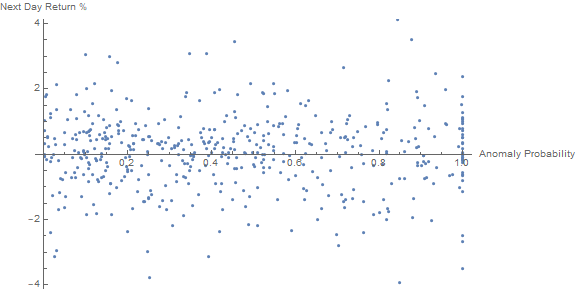
The conclusion here is that there is essentially no relation between prior day anomaly and next-day future returns, indicating the prior behavior was not coincidental and that anomalies are relatively quick and not long term.
Future Work
In the future, I aim to refine the stock pricing anomaly conversion model and perform further analysis with the anomaly signal and more methods of anomaly detection should be explored. The fidelity of these methods should be examined with rigor. Further work on examining the notion of systemic anomaly should be performed to yield more insight into the nature of market anomaly. Other data sources may be incorporated (e.g. macroeconomic factors, recent events) to facilitate this task. More stocks may be examined beyond the Dow Jones. The anomaly signal itself may also be examined in further detail to took for patterns such as those of seasonality.
Acknowledgements
I would like to thank WSC19 and my mentor Dr. Phil Maymin for providing guidance with regards to my project.
Notebook
Here is my notebook containing the processed data as well as more visualization, analysis, and work regarding the stability and fidelity of the anomaly detection routines.


