 (more graphs in sample graphs section)
Introduction
Phylogenetic trees are meant to show evolutionary relationships between species, and versions exist that show historical developments of programming languages. However, these relationships are limited in terms of showing how similar syntaxes are of different languages. This project's goal was to develop graphs that show relationships between computer languages, that are based off of syntactical factors instead of historical factors. Such graphs would be valuable because in addition to showing similarities between languages, they could provide insight on the order that would be easiest for learning new languages. It also would give more insight into the potential of machine learning to determine such relationships.
Collecting and Saving the Data
Rosetta Code is a website with a list of coding tasks and their implementations in different languages. The advantage in the website is that languages can be directly compared for the same programs. It is the only data source for this project, and for programs that have more than one solution for the same language, the first language is used.
The following functions are defined that will be able to scrape the programs off of the Rosetta Code website.
To save time by not having to import anything more than once, the importOneTime function is defined so that values can be saved.
importOneTime[args___] :=
  importOneTime[args] = Import[args];
First, a list of all languages is obtained by parsing the html on the Rosetta Code languages page.
allLanguages =
  Sort@
    Select[
     importOneTime[
      "http://rosettacode.org/wiki/Category:Programming_Languages",
      "Hyperlinks"],
     StringMatchQ[#,
        "http://rosettacode.org/wiki/Category:*"] &&
       !
        StringMatchQ[#, "*Programming*" | "*Languages*" |
          "Encyclopedia*" | "*Cach*"] &] /.
   x_String :> StringReplace[x,
     "http://rosettacode.org/wiki/Category:" -> ""];
The Rosetta Code website has each language spelled in a specific way, but there are some exceptions, so the following additions are made to help when extracting code in case the user mistypes the language name. Specific user inputs are now treated as the correct spelling.
languageTag[lang_String] :=
  ToLowerCase[StringReplace[StringReplace[lang, "_" -> " "],
    {"c++" | "C++" -> "cpp", "#" -> "sharp", "Common Lisp" -> "Lisp",
     "Liberty Basic" -> "lb", "Objective C" -> "objc",
     "BASIC" -> "qbasic", "UNIX Shell" -> "bash",
     "Visual Basic" -> "vb", " " -> "", "/" -> "", "-" -> ""}]];
Extracting code will require comparing positions of values in a tree, where positions are described by lists. The following function is defined to compare tree-traversal lists, element-by-element, and to stop as soon as it finds a difference, picking the higher one.
posGreater[a_List, b_List] :=
 Module[{i},
  i = 1;
  While[a[[i]] === b[[i]] && i < Min[Length[a], Length[b]],
   i = i + 1];
  Return [a[[i]] > b[[i]]]]
The extractCode function is now defined, and it works by parsing the html on a given Rosetta Code problem page to get the program for a given language. Not every language has the same html surrounding its program, so the function checks for multiple cases.
extractCode[path_, language_] :=
 StringTrim[Block[{langPos, langhead, allheads, nexthead, codeText,
    codeXML, pageXML},

   (*Retrieves the XML*)
   Echo[pageXML =
     importOneTime[path, "XMLObject"] /.
      XMLElement[tag_, b___] :> XMLElement[ToLowerCase[tag], b],
    "xml"];
   langPos = Position[pageXML,
     "class" -> languageTag[language] <> " highlighted_source"];

   If[Length[langPos] >= 1,
    (*Code was correctly tagged, can be extracted*)
    codeXML = Extract[pageXML, #[[;; -3]]][[3]] & /@ langPos,
    (*Code was incorrectly tagged, requires further searching*)
    langhead = Position[pageXML,
      XMLElement["h2", _, cts_] /;
       MemberQ[cts, language, \[Infinity]]];
    (*Look for a section heading containing the language's name*)
    If[Length[langhead] == 1,
     langhead = First[langhead];
     (*Search for all section headings*)
     allheads = Sort[Position[pageXML, XMLElement["h2", _, _]]];
     nexthead = allheads /. {{a___, langhead} -> \[Infinity],
        {a___, langhead, n_, b___} -> n};
     (*Extract all XML tagged with generic source code tag
     between the two section heads*)
     codeXML = Extract[pageXML,
       Select[Position[pageXML,
         XMLElement["pre", {"class" -> "text highlighted_source"},
          source_]],
        posGreater[#, langhead] && posGreater[nexthead, #] &]
       ];
     , codeXML = "";
     ]];
   (*Convert the extracted XML to text*)
   Apply[StringJoin, codeXML //. {
      XMLElement["pre", {"class" -> "text highlighted_source"},
        source_] -> source,
      XMLElement["br", _, _] -> "\n",
      XMLElement[_, _, {text___}] -> text}
    ]]]
Sometimes a task is listed for a given language on the Rosetta Code page but it ends up being empty. For this reason, a simple function is created to count the characters of a program, and it will be used to filter out any empty programs.
characterCount[str_] :=
  StringLength[
   StringReplace[str, {"\n" -> "", " " -> "", "\t" -> ""}]];
Now, parsing the html for a given programming language allows for the generation of a list of all tasks on Rosetta Code which have a solution written in that language. The function gets a list of every task for a language, using the characterCount function to filter out any empty programs.
getCompletePageList[language_String] :=
  Module[{links},
  links =
   Cases[
    DeleteCases[
     importOneTime[
      "http://rosettacode.org/wiki/Category:" <>
       StringReplace[language, " " -> "_"], "Hyperlinks"],
     x_String /;
      (StringMatchQ[x, StringExpression[
         "*Category*" | "*Reports:*" | "*Rosetta_Code*" |
          "*Language_Comparison_Table*" | "*Help:*" | "*User:*" |
          "*Special:*" |
          ("*" <> StringReplace[language, " " -> "_"])]])],
    x_String /; StringMatchQ[x, "http://rosettacode.org/wiki/*"]];
  Select[links, characterCount[extractCode[#, language]] >= 1 &]]
Generating any graph will require the code for each language to be used as data, so this is imported once and saved.
This list of lists is defined by iterating through every language and calling getCompletedPageList to find all links that have nonempty programs for the language on them. This contains all links that need to be used. Running this takes a long time, so the progress is monitored. Once finished, the data is saved.
tasksForLang =
  Map[Monitor[getCompletePageList[#], #] &, allLanguages];
Future graphs will often be generated by using the top n most common languages on Rosetta Code, so now that the amount of programs per language is known, the following list can be ordered to rank all languages by how much data they have on Rosetta Code. As a list of tuples, it also contains the information of how many nonempty programs each language has.
popularOrder =
  Reverse@SortBy[
    Partition[Riffle[allLanguages, Map[Length[#] &, tasksForLang]],
     2], #[[2]] &];
Now that all links are listed, a one-time extraction can be done from every single link to get the program. Since this takes a while, it is also monitored. The resulting programs are saved in a list of lists which has the same dimensions as taskForLang.
codeForLang = Module[
   {copyOfTasksForLang = tasksForLang},
   Monitor[For[i = 1, i <= Length[tasksForLang], i++,
     For[j = 1, j <= Length[tasksForLang[[i]]], j++,
      copyOfTasksForLang[[i]][[j]] =
       extractCode[tasksForLang[[i]][[j]], allLanguages[[i]]]
      ]
     ], allLanguages[[i]]];
   Return[copyOfTasksForLang]
   ];
Now the results are saved for future reference:
DumpSave["RosettaCodeData.mx", {allLanguages, tasksForLang,
   codeForLang}];
Importing Saved Data
The saved data can be imported as generating it can take upwards of an hour. This file can be found in my GitHub repository PhylogeneticGraphs (https://github.com/mshundi/PhylogeneticGraphs).
Clear[allLanguages, tasksForLang, codeForLang]
Import["RosettaCodeData.mx"]
Creating Functions that will be Used to Generate Graphs
The function that generates graphs will accept either an integer specifying the top n languages, a string of language names separated by spaces, or a list of languages. Three versions of the same function are written -- one for each type of input -- and in case the input is first validated. If the input is invalid, default values are used instead.
This pair of functions calculates the top n programs based on amount of data, and rounds up if there are any ties.
hasAtLeastNPrograms[n_] :=
  Length[Select[popularOrder, #[[2]] >= n &]];

thresholdForTopNPrograms[n_] :=
  Module[{m = 0},
   While[hasAtLeastNPrograms[m] > n, m++]; Return[m]];
These functions calculate what languages will be used based on the input of the user. Each has the same name but a different input type so it can easily be called.
languageGenerator[n_Integer] :=
  Module[{m},
   If[n < 2, m = 2, m = n];
   machineLearningLanguages =
    programlistofpopularityn[thresholdForTopNPrograms[m]]];

languageGenerator[n_String] :=
  machineLearningLanguages = StringSplit[n];

languageGenerator[n_List] :=
  machineLearningLanguages = n;
This function is made to get the first n programs for a language and it will be used when selecting programs to add to the dataset.
firstNForLang[n_Integer, lang_String] :=
     Take[codeForLang[[
        Position[allLanguages, lang][[1]][[1]]
        ]], n]
When a matrix is generated of all languages that get confused for one another, this function will return a list of edges represented as ordered triples, with the third element representing the weight of the edge. It then returns all edges whose weights are at least at a specified threshold, while not exceeding the upper limit for the threshold.
weightedEdges[n_, langs_, matrix_] :=
 Module[{list = {}, sorted = Sort[langs], returnedList},
  For[i = 1, i <= Length[langs], i++,
   For[j = i + 1, j <= Length[langs], j++,
    AppendTo[list, {sorted[[i]], sorted[[j]], matrix[[j]][[i]]}];
    AppendTo[list, {sorted[[j]], sorted[[i]], matrix[[i]][[j]]}]
    ]];
  (*Edges are reverse sorted by weight in case weak ones need to be
trimmed off*)
  returnedList =
   Select[ReverseSortBy[list, #[[3]] &], #[[3]] >= n &];
  (*Errors occur when passing this limit, so the excess,
  weak edges are trimmed*)
  If[Length[returnedList] >= 896,
   returnedList = returnedList[[;; 896]],
   returnedList = returnedList
   ];
  Return[returnedList]
  ]
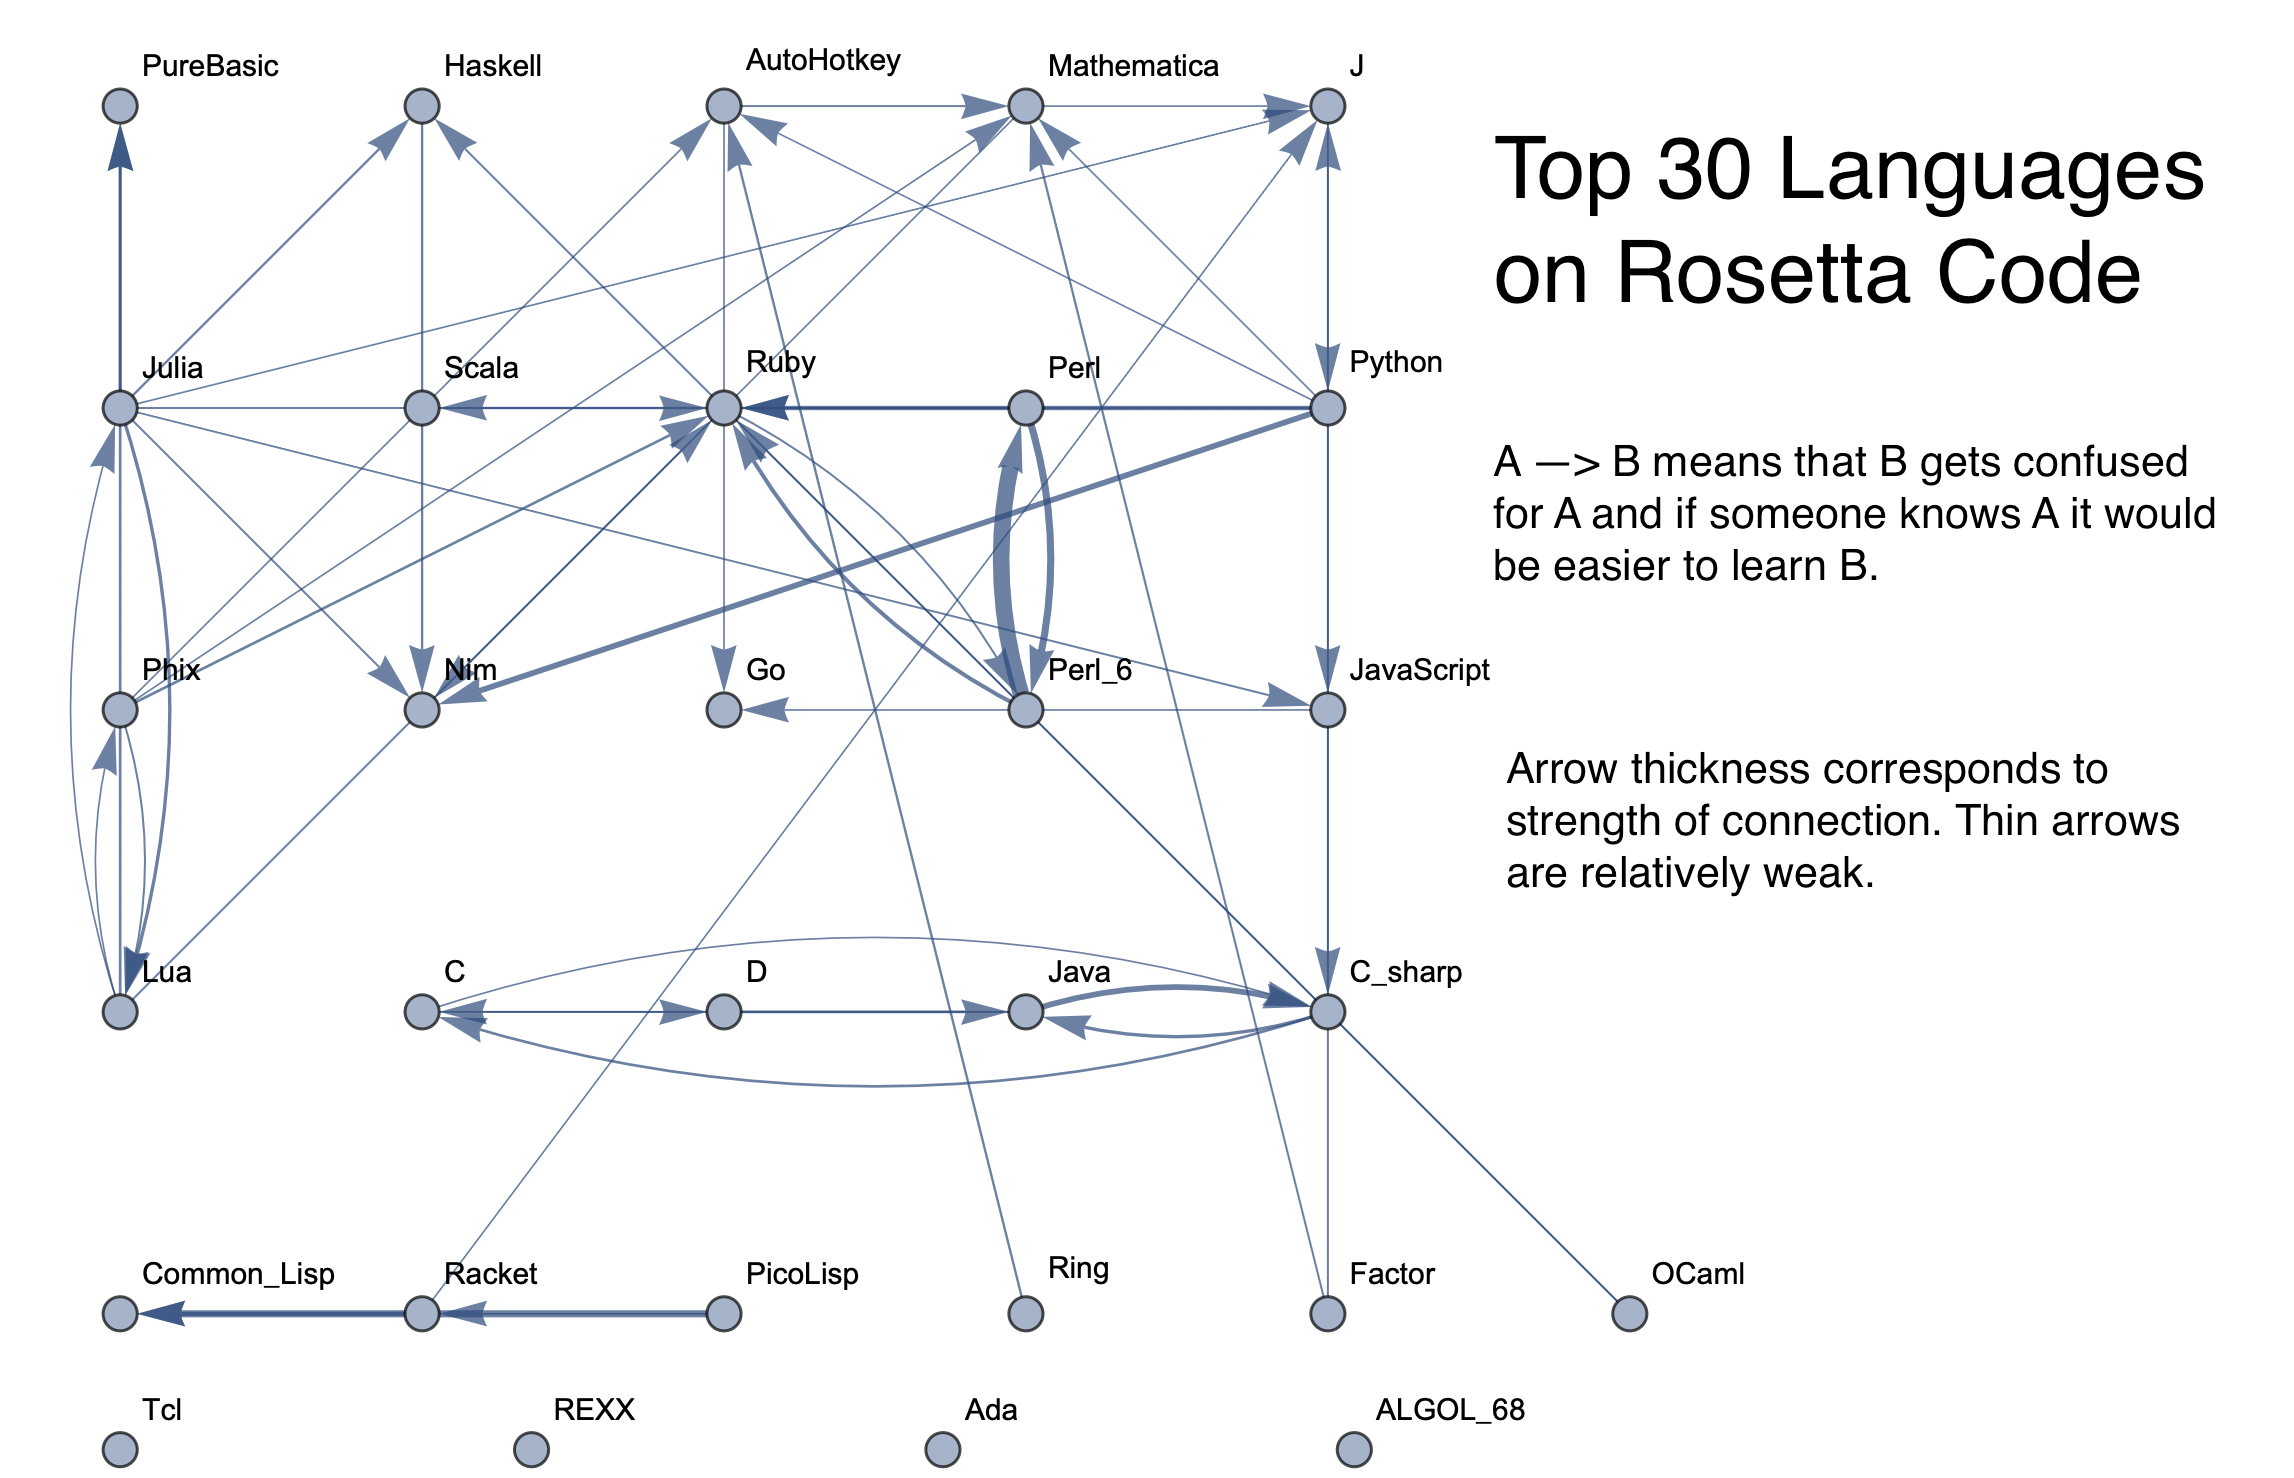
Now the function that will ultimately make a graph when given the necessary input is created. This takes in a threshold, a graph layout, a list of all languages that will be included on the graph, and the confusion matrix from the machine learning testing. It calls weightedEdges to get a list of edges to use. The results are used to create a graph where the thickness of an edge linearly corresponds to its weight. These weights are just how often two languages get confused for each other. An arrow on the graph going from A to B means that B gets mistaken as A, meaning that B is similar and would be easier to learn if one already knows A.
graphAnEdgeList[n_, layout_: Automatic, langs_, matrix_] :=
  Module[{weights = {}, edge = {},
    edges = weightedEdges[n, langs, matrix]},
   Map[AppendTo[weights, #[[3]]/5000.0] &, edges];
   Map[AppendTo[edge, #[[2]] -> #[[1]]] &, edges];
   Graph[langs, edge,
    EdgeStyle -> Thread[edge -> (Thickness[#] & /@ weights)],
    VertexLabels -> "Name", GraphLayout -> layout]
   ];
Making the Graphing Functions
Two functions are made, one which outputs a manipulable graph and one which outputs a static graph.
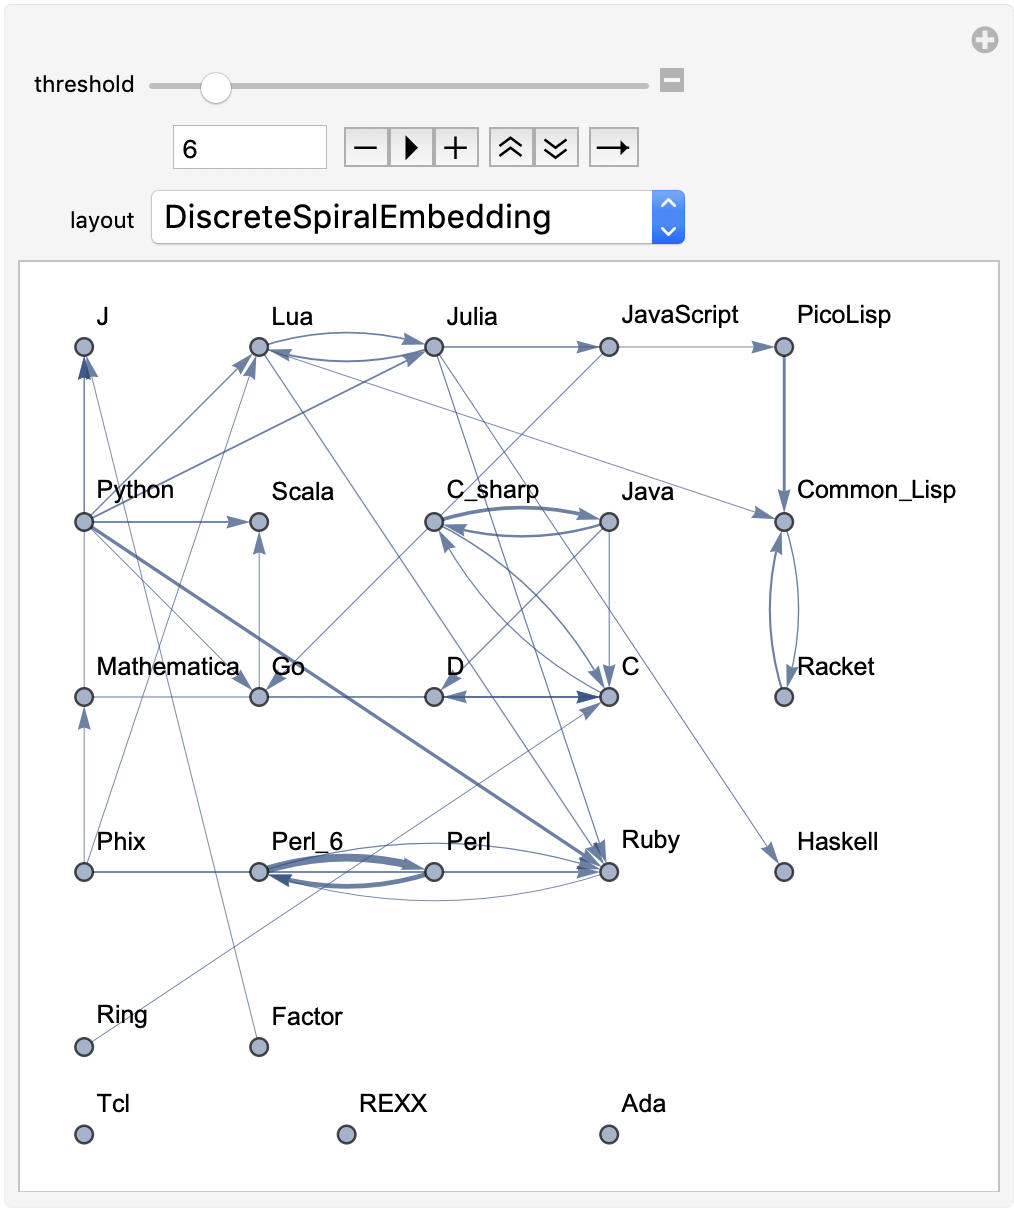
For the manipulable graph, the input will be one parameter: either an integer denoting the top n languages, a string of space-separated languages, or a list of languages. The output will be a manipulable graph where the user will be able to change the threshold for edges that are included and change the graph layout.
The following well-documented function is used to create the manipulable graph.
phylogeneticGraph[languagestoinclude_] :=

 Module[{machineLearningLanguages = {}, programsToUsePerLanguage,
   datasetPrograms, dataset, matrixValues, minThresh, dataTraining,
   dataTesting, dataClassifier, dataClassifierTesting},

  (*Generates the list of languages to use based on user input*)

  machineLearningLanguages = languageGenerator[languagestoinclude];

  (*Display errors sometimes occur at high numbers and low thresholds,
  so the minimum threshold is adjusted based on how many languages \
are being used*)

  If[Length[machineLearningLanguages] > 50, minThresh = 3,
   minThresh = 1];

  (*Finds the minimum amount of data that any of the programs being \
used has,
  and uses that number as the amount of tasks to use for each \
language when making the dataset.*)
  programsToUsePerLanguage =
   Min[Map[
     Length[tasksForLang[[Position[allLanguages, #][[1]][[1]]]]] &,
     machineLearningLanguages]];

  (*Makes a list of lists of all programs to use for the dataset by \
picking the same amount from each,
  which was calculated in programsToUsePerLanguage*)

  datasetPrograms =
   Map[firstNForLang[programsToUsePerLanguage, #] &,
    machineLearningLanguages];

  (*Creates a 2-column dataset of language and program.
  These are taken directly off of datasetPrograms*)

  dataset =
   Association @@@ Flatten[Map[Table[{"code" -> datasetPrograms[[
              Position[machineLearningLanguages, lan][[1]][[1]]]][[#]],
          "language" -> lan}, {lan, machineLearningLanguages}] &,
       Range[programsToUsePerLanguage]], 1] // Dataset;

  (*Splits the dataset into training data and testing data in a ratio \
of 1 to 2*)
  {dataTraining, dataTesting} =
   TakeDrop[dataset, Round[Length[dataset]/3]];

  (*Creates a classifier based on predicting the language given the \
code, training it and testing it on the designated parts of the data \
set*)
  dataClassifier =
   Classify[dataTraining -> "language", PerformanceGoal -> "Speed"];
  dataClassifierTesting =
   ClassifierMeasurements[dataClassifier, dataTesting -> "language"];

  (*Gets a confusion matrix based on wrong classifications made by \
the classifier. It will be used as the basis of generating the graph*)

    matrixValues =
   dataClassifierTesting[{"Precision", "ConfusionMatrix"}][[2]];
  Length[weightedEdges[1, machineLearningLanguages, matrixValues]];

  (*Makes a Manipulable graph where the user can change the layout \
and threshold.
  The minimum threshold is determined based on the amount of \
languages and the maximum threshold is determined based on the \
strength of the strongest edge*)

  Manipulate[
   graphAnEdgeList[threshold, layout, machineLearningLanguages,
    matrixValues], {threshold, minThresh,
    weightedEdges[1, machineLearningLanguages, matrixValues][[1]][[3]],
    1}, {layout, {Automatic, "BipartiteEmbedding",
     "CircularEmbedding", "CircularMultipartiteEmbedding",
     "DiscreteSpiralEmbedding", "GridEmbedding", "LinearEmbedding",
     "MultipartiteEmbedding", "SpiralEmbedding", "StarEmbedding"}}]]
For example, using the function to give a manipulable graph for the top 25 languages gives:
phylogeneticGraph[25]
To make a static graph, this function essentially does the same thing as the previous function, but instead of outputting a manipulable graph, it only gives one static graph. Because it doesn't allow the user to change parameters once the graph is generated, it takes in the arguments for threshold and layout as inputs.
staticPhylogeneticGraph[languagestoinclude_, threshold_Integer,
  layout_String] :=
 Module[
  {machineLearningLanguages = {}, programsToUsePerLanguage,
   datasetPrograms, dataset, matrixValues, minThresh, dataTraining,
   dataTesting, dataClassifier, dataClassifierTesting},

  (*Generates list of languages to use based on user input*)

  machineLearningLanguages = languageGenerator[languagestoinclude];

  (*Display errors sometimes occur at high numbers and low thresholds,
  due to having too many branches,
  so the minimum threshold is adjusted based on how many languages \
are being used.*)

  If[Length[machineLearningLanguages] > 50, minThresh = 3,
   minThresh = 1];

  (*Finds the minimum amount of data that any of the programs being \
used has,
  and uses that number as the amount of tasks to use for each \
language when making the dataset.*)
  programsToUsePerLanguage =
   Min[Map[
     Length[tasksForLang[[Position[allLanguages, #][[1]][[1]]]]] &,
     machineLearningLanguages]];

  (*Makes a list of lists of all programs to use for the dataset by \
picking the same amount from each,
  which was calculated in programsToUsePerLanguage*)

  datasetPrograms =
   Map[firstNForLang[programsToUsePerLanguage, #] &,
    machineLearningLanguages];

  (*Creates a 2-
  column dataset of language and program in cycling order of form.
  These are taken directly off of datasetPrograms*)

  dataset =
   Association @@@ Flatten[Map[Table[{"code" -> datasetPrograms[[
              Position[machineLearningLanguages, lan][[1]][[1]]]][[#]],
          "language" -> lan}, {lan, machineLearningLanguages}] &,
       Range[programsToUsePerLanguage]], 1] // Dataset;

  (*Splits the dataset into training data and testing data in a ratio \
of 1 to 2*)
  {dataTraining, dataTesting} =
   TakeDrop[dataset, Round[Length[dataset]/3]];

  (*Creates a classifier based on predicting the language given the \
code, training it and testing it on the designated parts of the data \
set*)
  dataClassifier =
   Classify[dataTraining -> "language", PerformanceGoal -> "Speed"];
  dataClassifierTesting =
   ClassifierMeasurements[dataClassifier, dataTesting -> "language"];

  (*Gets a confusion matrix based on wrong classifications made by \
the classifier. It will be used as the basis of generating the graph*)

    matrixValues =
   dataClassifierTesting[{"Precision", "ConfusionMatrix"}][[2]];
  Length[weightedEdges[1, machineLearningLanguages, matrixValues]];

  (*Generates the static graph by calling graphAnEdgeList*)

  graphAnEdgeList[minThresh + Abs[threshold], layout,
   machineLearningLanguages, matrixValues]]
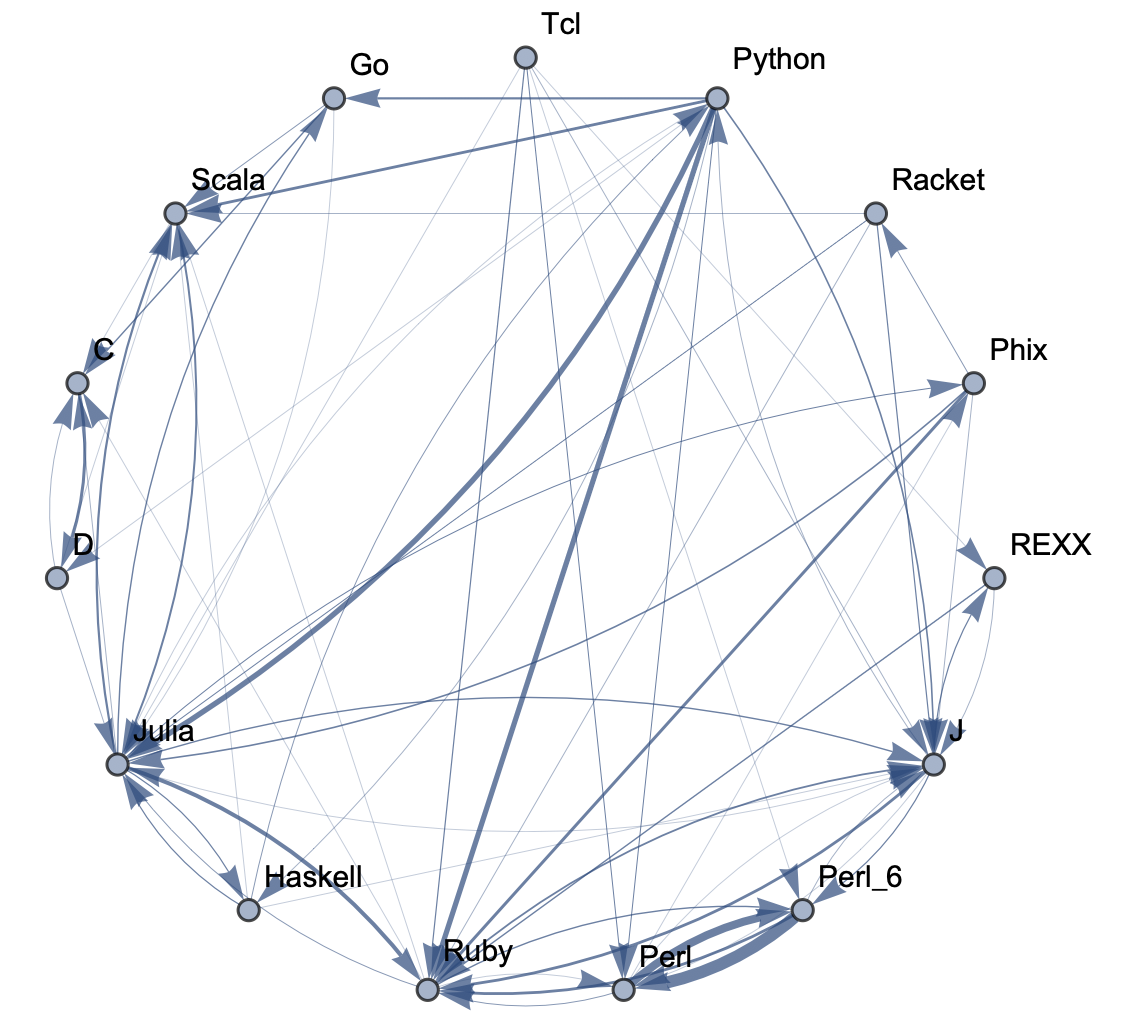
To see a low-threshold graph for top 15 languages in a circular display:
staticPhylogeneticGraph[15, 1, "CircularEmbedding"]
Summary of Results
The final product is functions that generate graphs for a list of languages, showing all connections having strength above a specified threshold, and having the thickness of edges correspond to their strengths. Relationships between programming languages were determined by how often a machine learning classifier would confuse languages for each other. On the graph, an arrow from A to B means that B gets confused for A, and someone who knows language A would therefore find it easier to learn language B. Few pairs of languages exist that have strong connections going both ways.
All data used came from Rosetta Code, which provides tasks written in different program languages. Individual programs were scraped off of the website by using Mathematica to parse the HTML. This data was saved once extracted, as there were close to 1,000 languages and almost 1,000 unique programming tasks. A data set would be made with programs of all languages that were going to be in the graph. The benefit of using Rosetta Code was that most of the data was of programs doing the same task but coded in different languages. A machine learning classifier would train and test on parts of the data, and confusion between languages would indicate a relationship, with higher amounts of confusion corresponding to a stronger relationship.
The are two main functions: one that creates a manipulable graph and one which creates a static graph. Both take in either an integer representing the top n languages or a string of space-separated languages. This determines what languages to include in the graph. The manipulable graph allows the user to change the threshold of the edge strength and the graph layout, while the static graph requires that these two are passed as parameters beforehand.
The results do have some limitations. While the overall data size was relatively large, it still represents a tiny subset of all available programs. Additionally, only Rosetta Code was used as a data source, and its programs are relatively short in length. While the code itself does work, it can also likely be cleaned up, and its performance can probably be improved.
In terms of using charts for deciding what languages to learn, the arrows might not tell the full story. A strong arrow from A to B might indicate that knowledge of A benefits one most in learning B, but it doesn't necessarily mean that B is the easiest to learn. It's still possible that there are languages completely unrelated to A which are still easier to learn than B. While the graphs should be considered, they don't provide information on the general complexity of a language or how easy or difficult it is to migrate to that language.
Sample Graphs
The following sample graphs are shown for the top n programs and for each n, multiple graphs are given with varying thresholds for minimum edge strength. Arrows from A to B indicate that B gets confused for A and that knowing A would make it easier to learn B.
Top 5 Languages: High Threshold 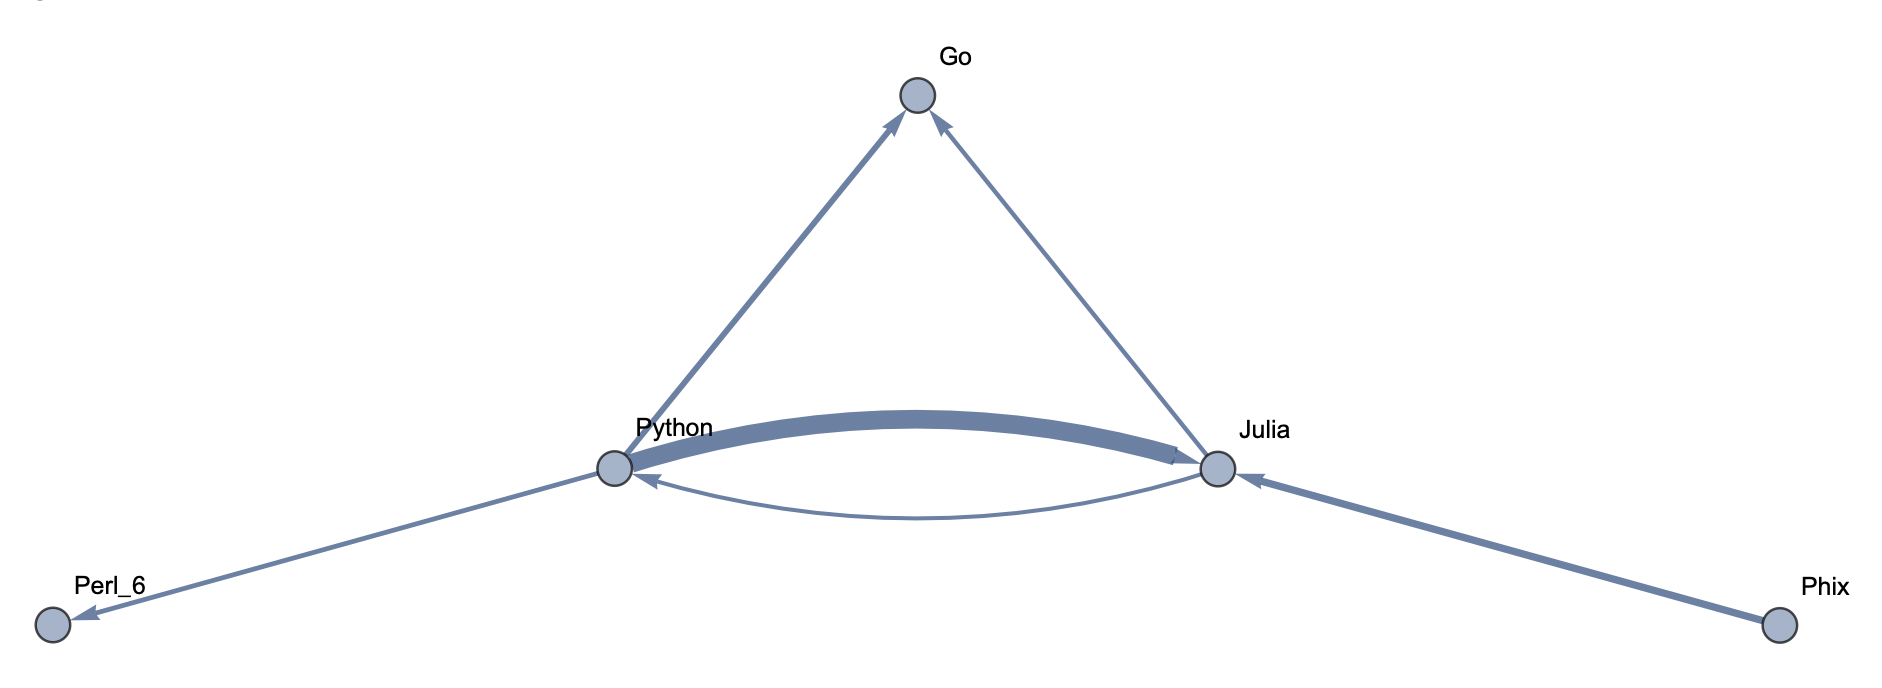 Top 5 Languages: Low Threshold
 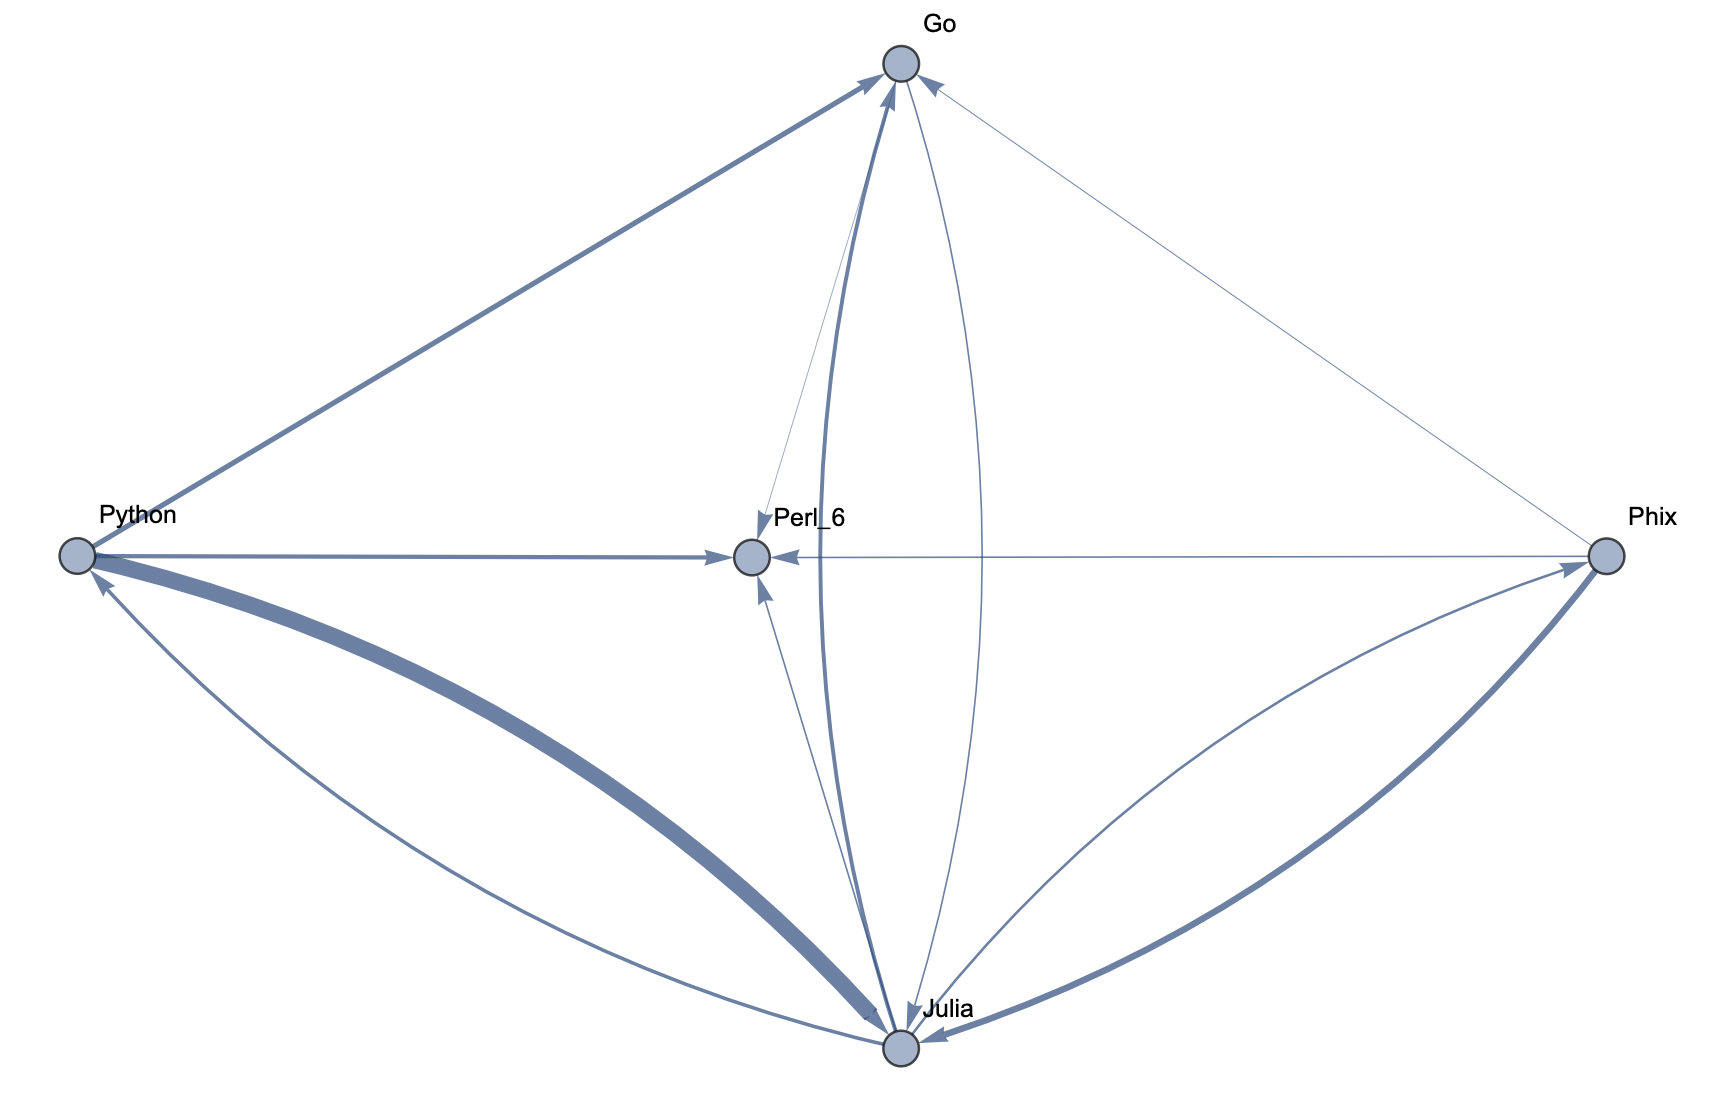 Top 10 Languages: High Threshold
 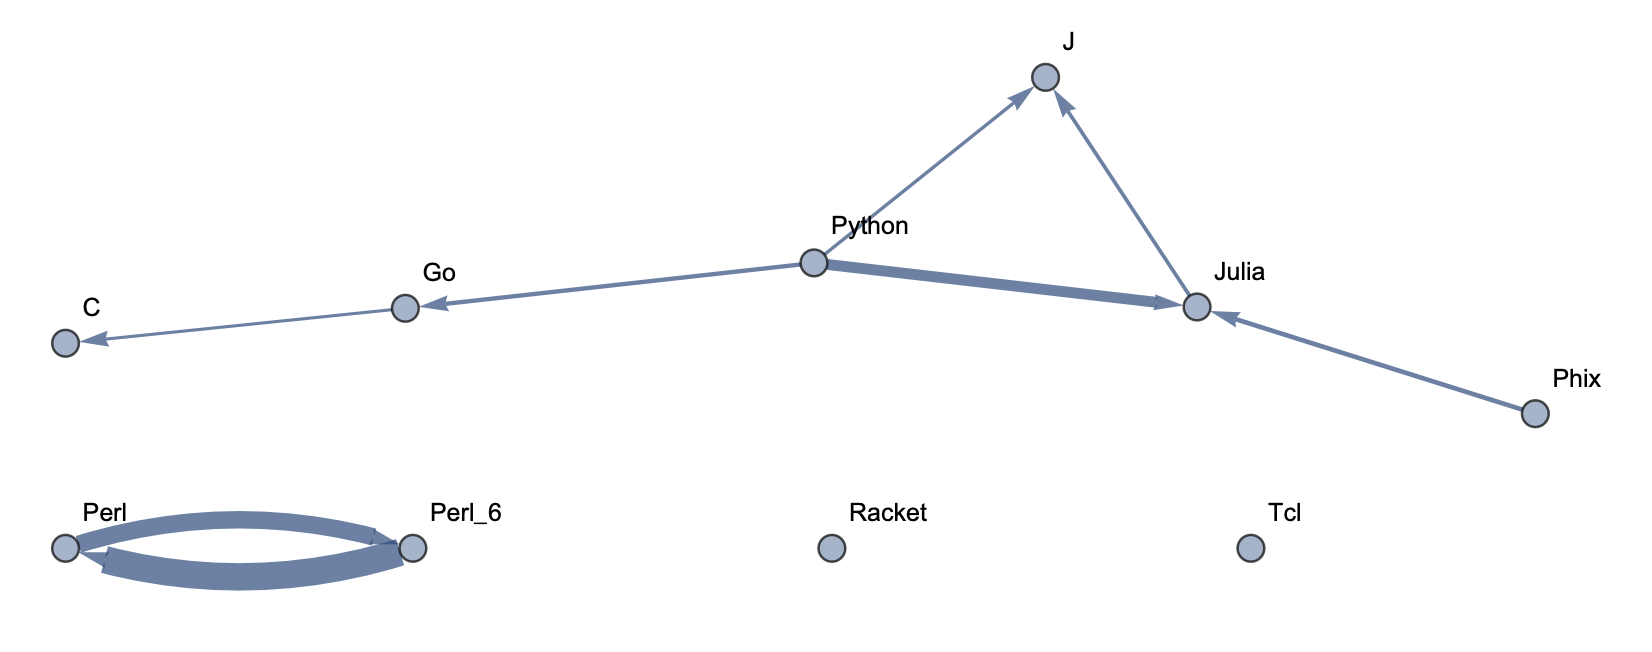 Top 10 Languages: Low Threshold
 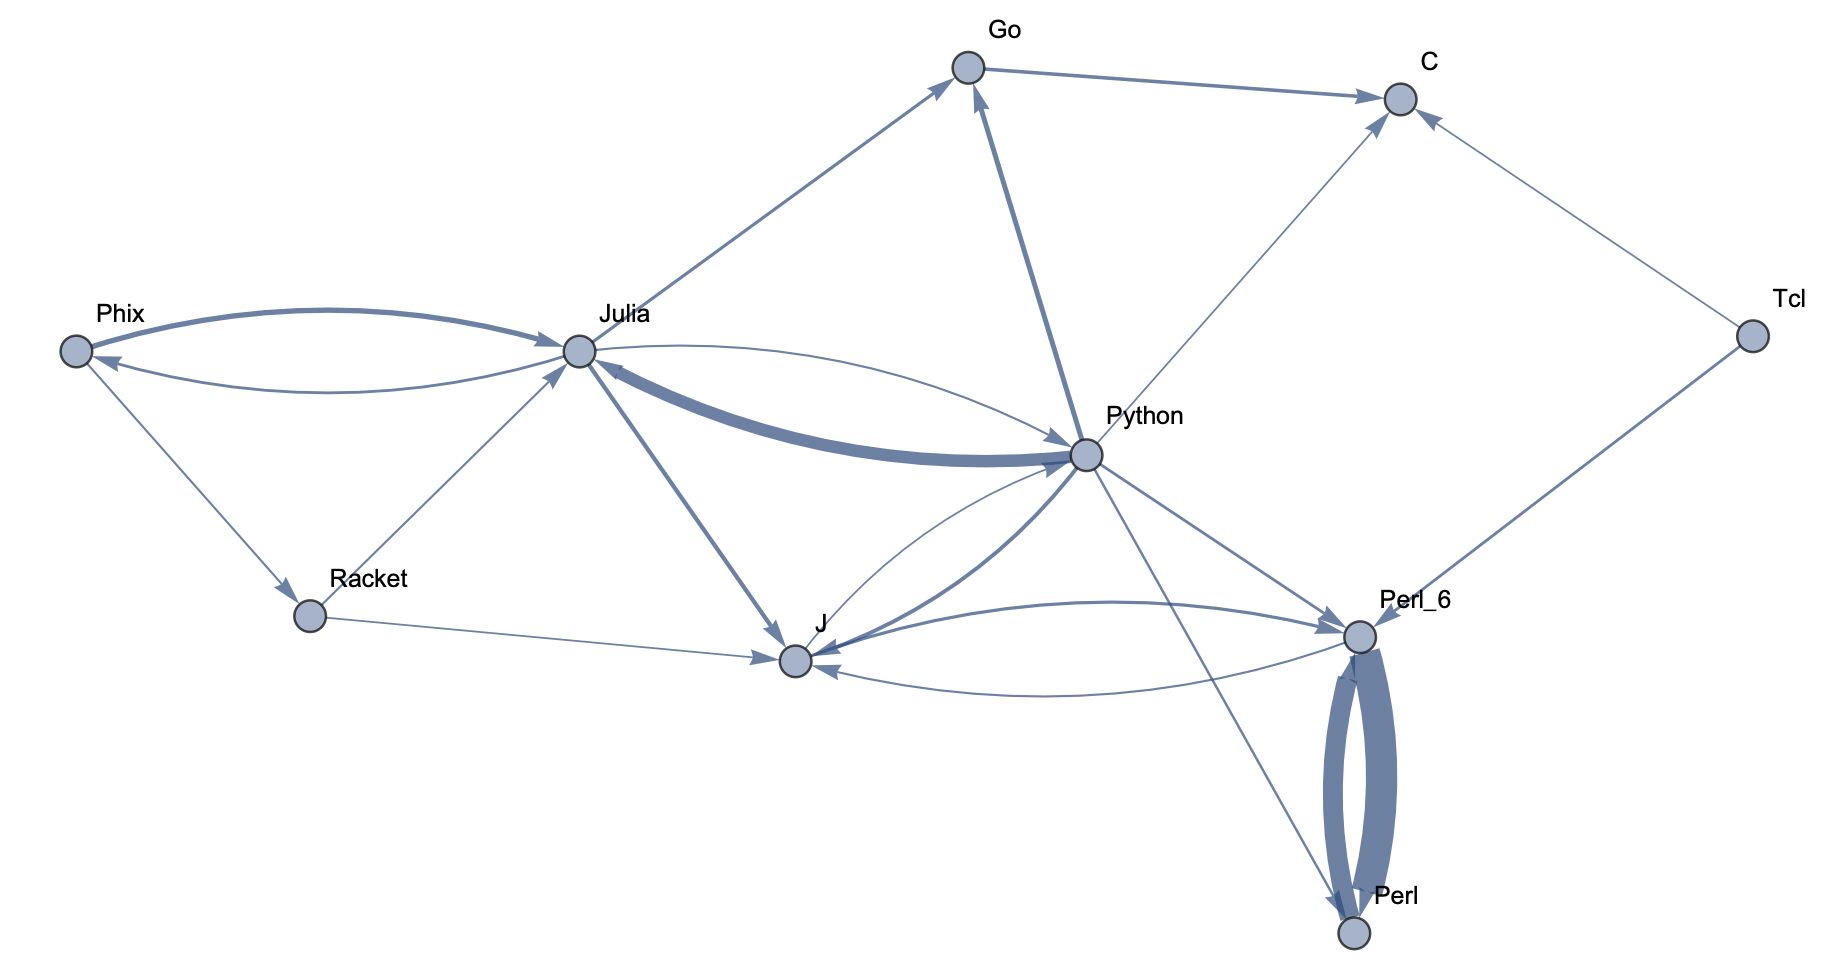 Top 15 Languages: High Threshold
 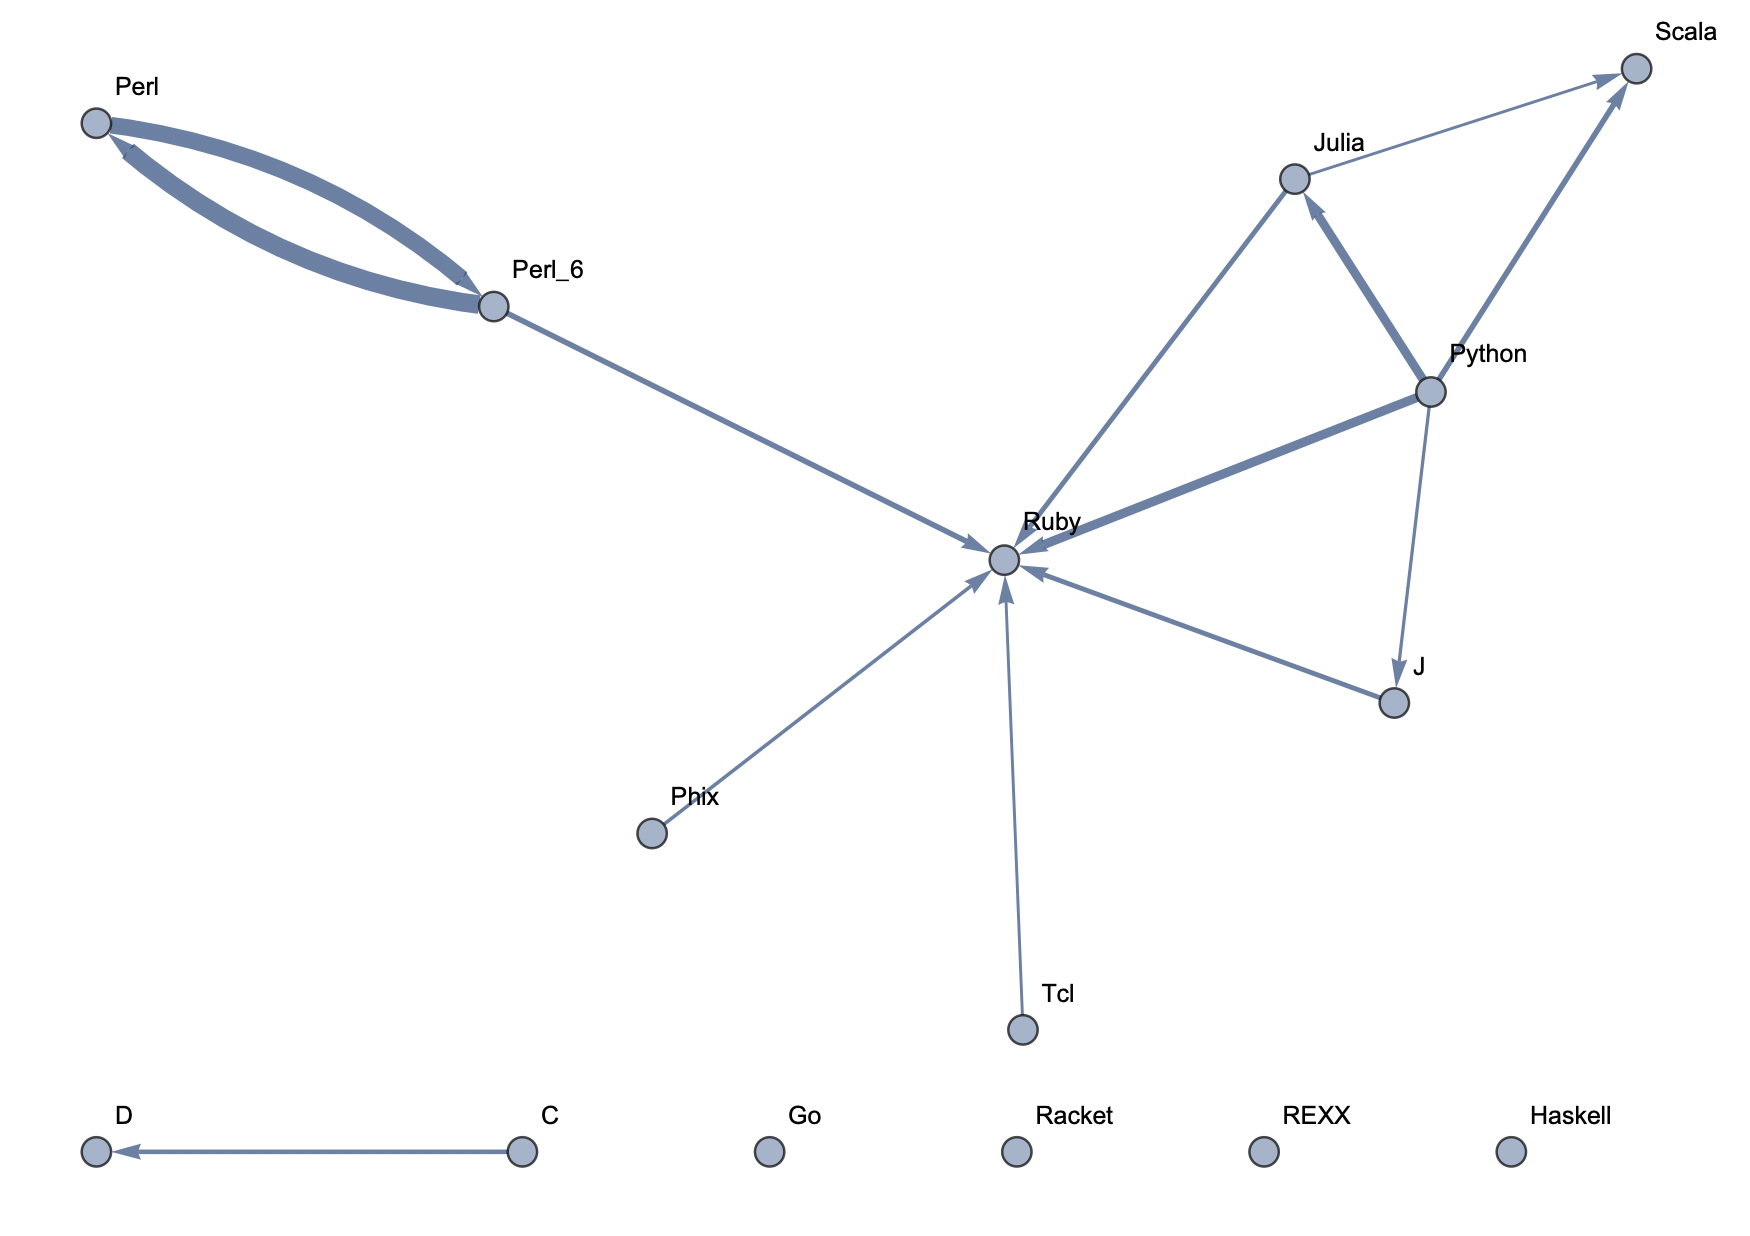 Top 15 Languages: Medium Threshold
 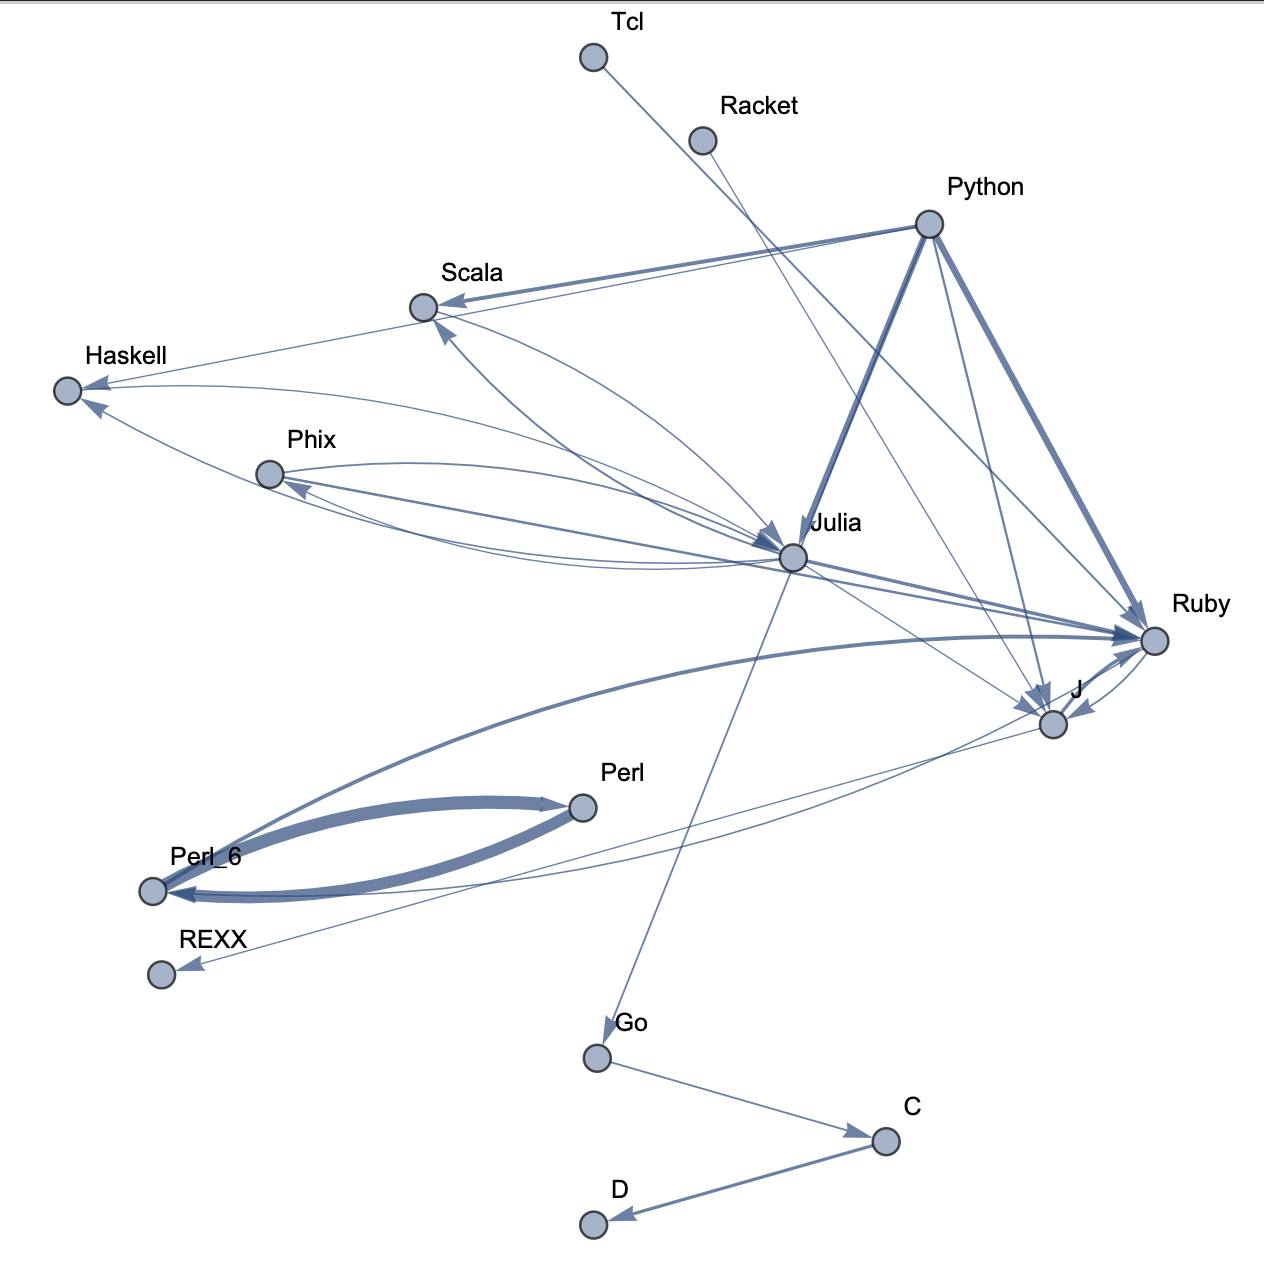 Top 15 Languages: Low Threshold
 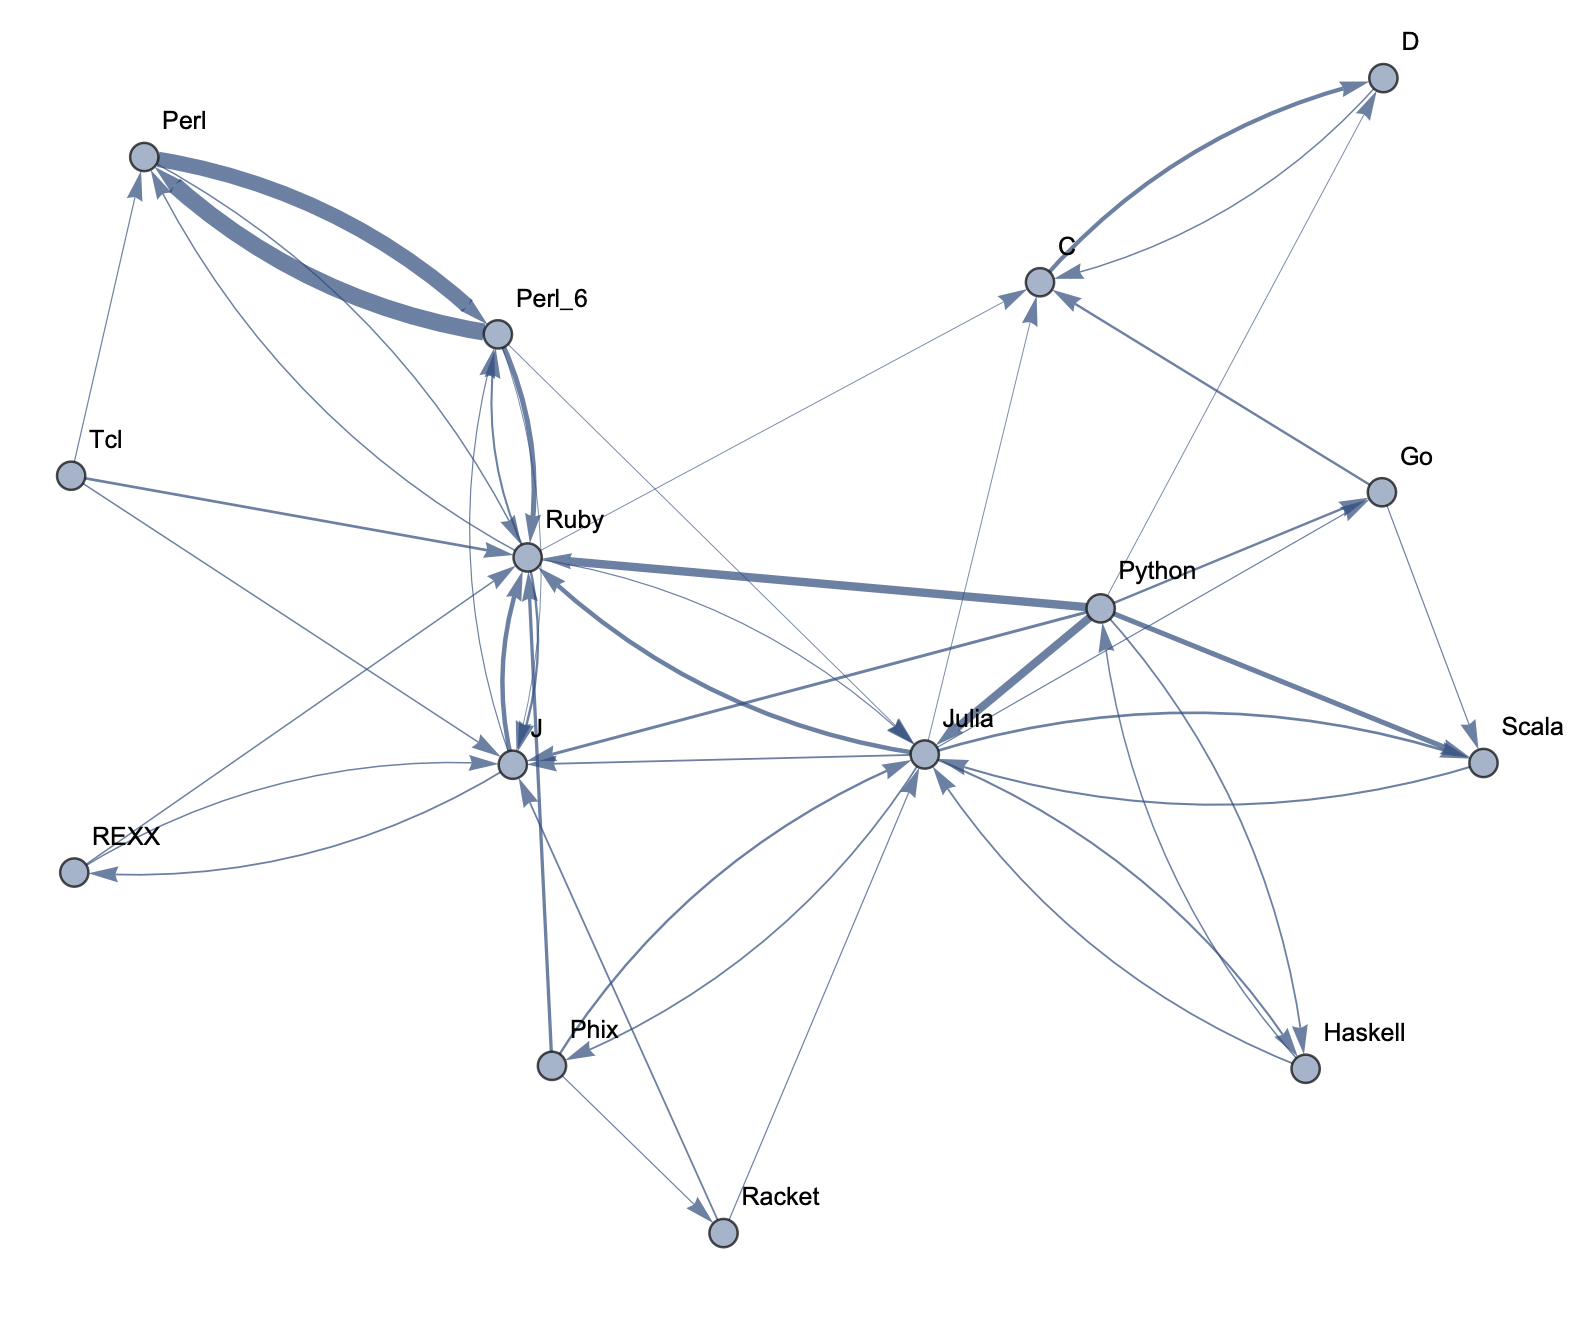 Top 20 Languages: High Threshold
 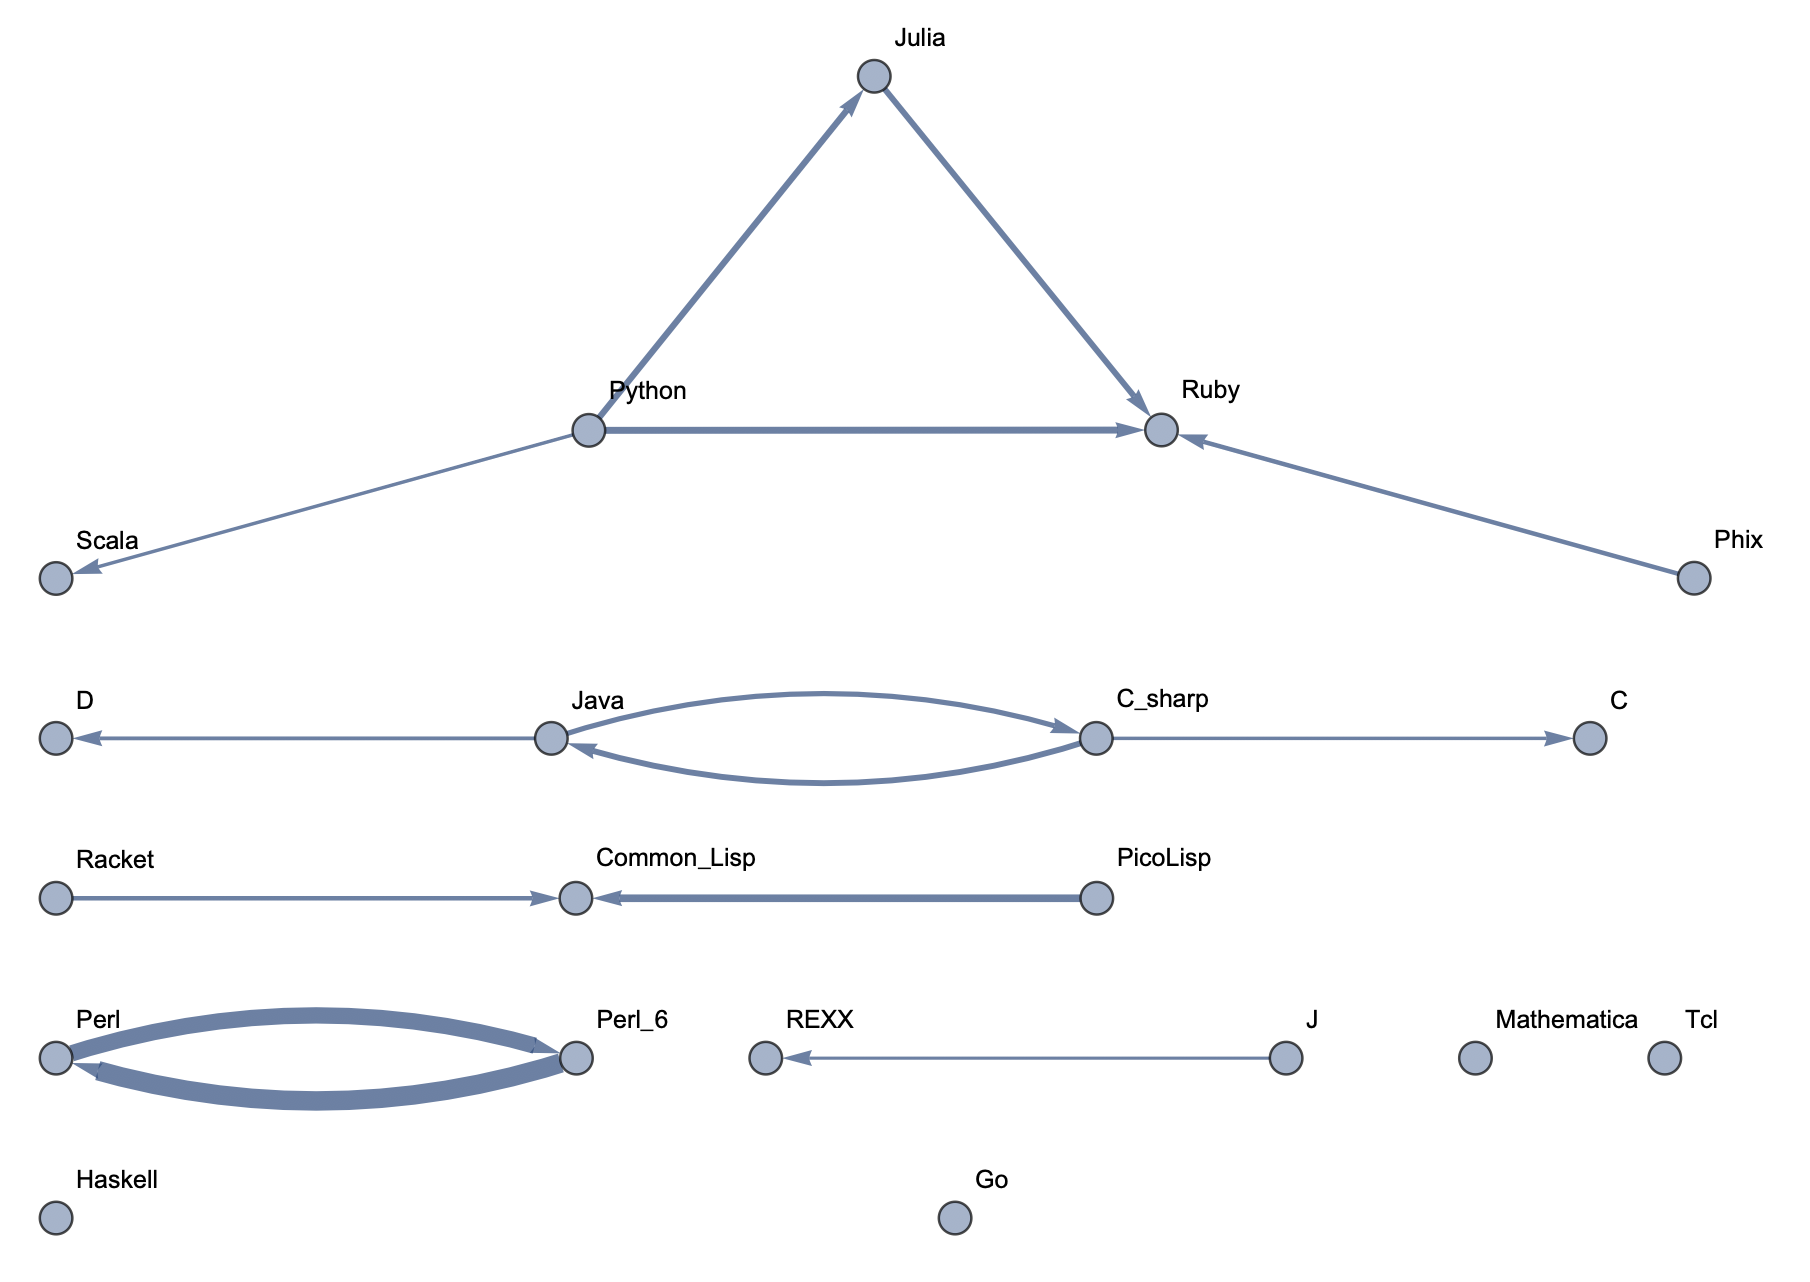 Top 20 Languages: Medium Threshold
 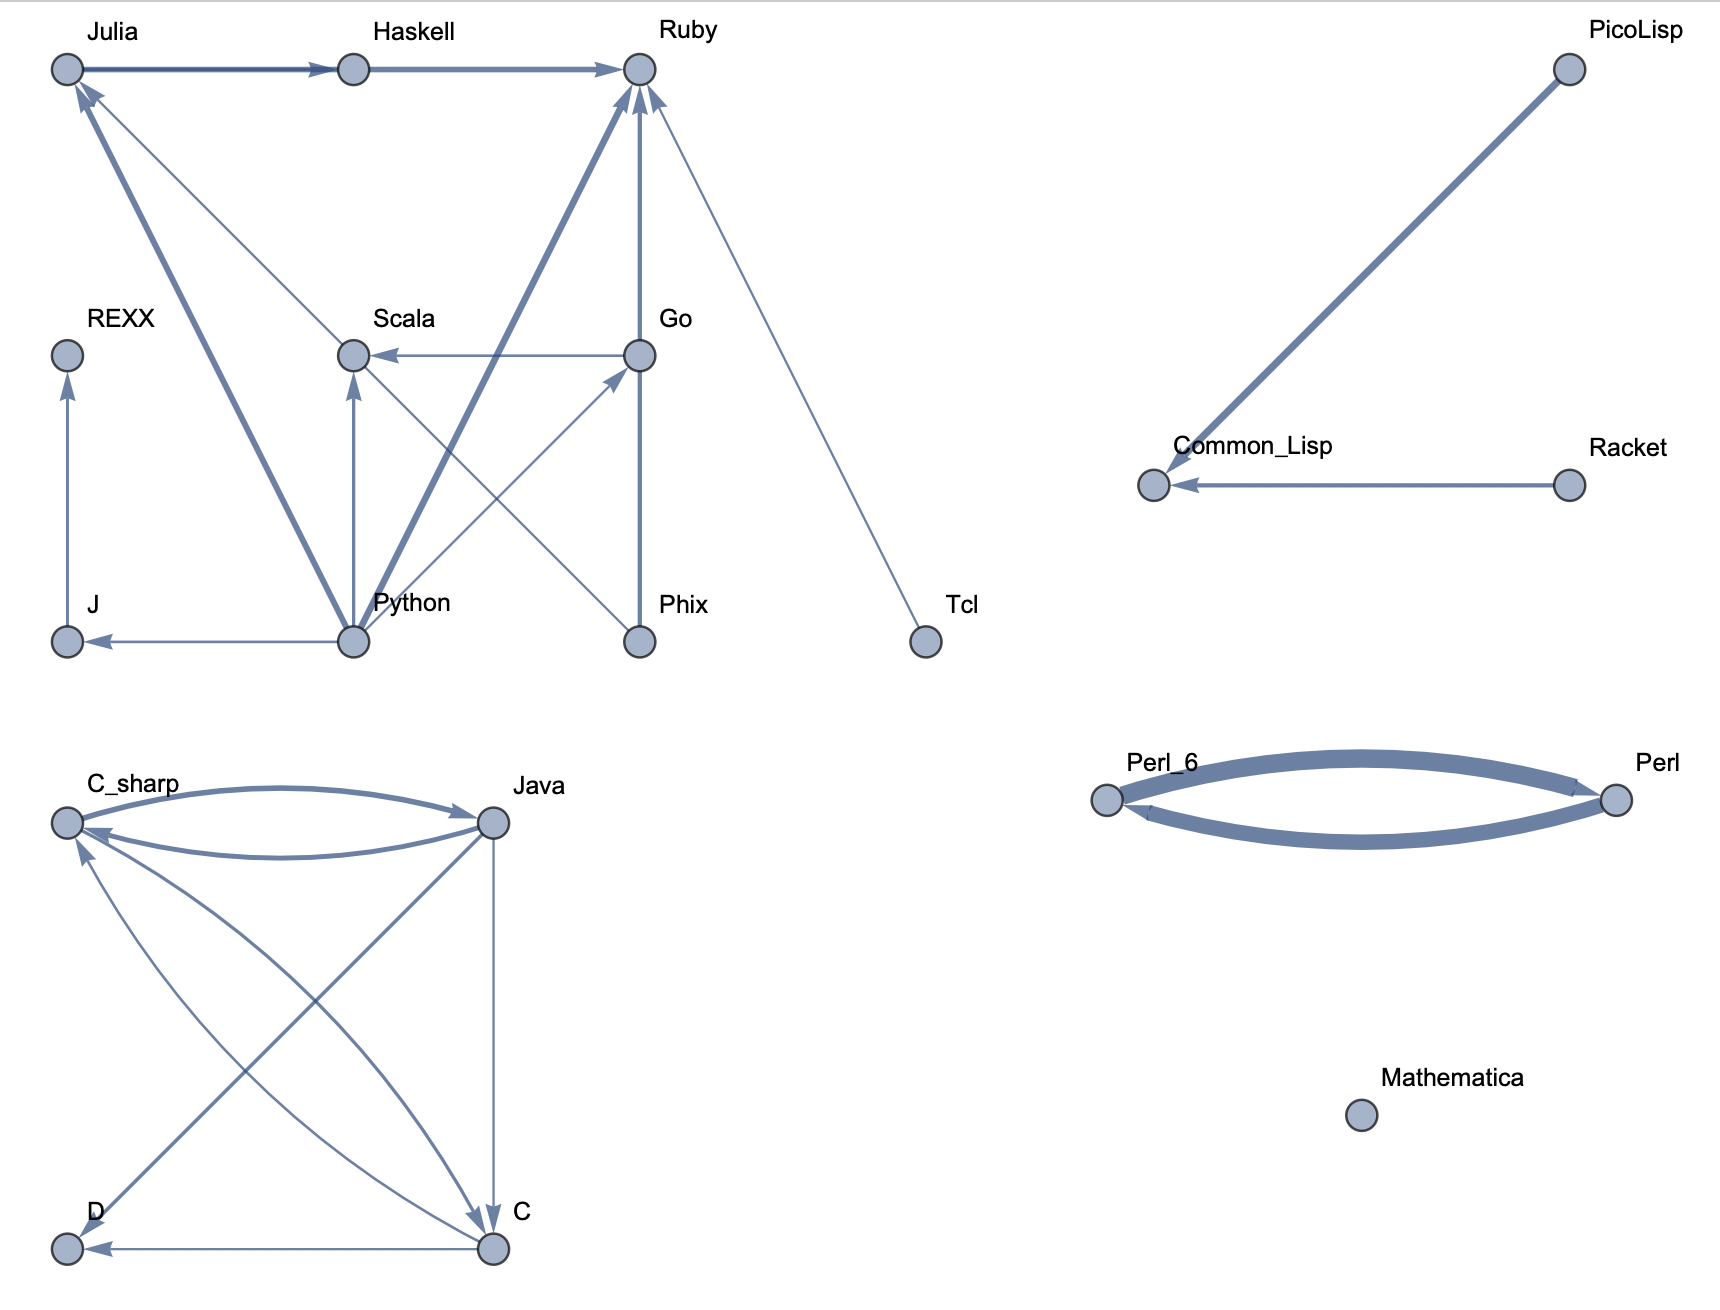 Top 20 Languages: Low Threshold
 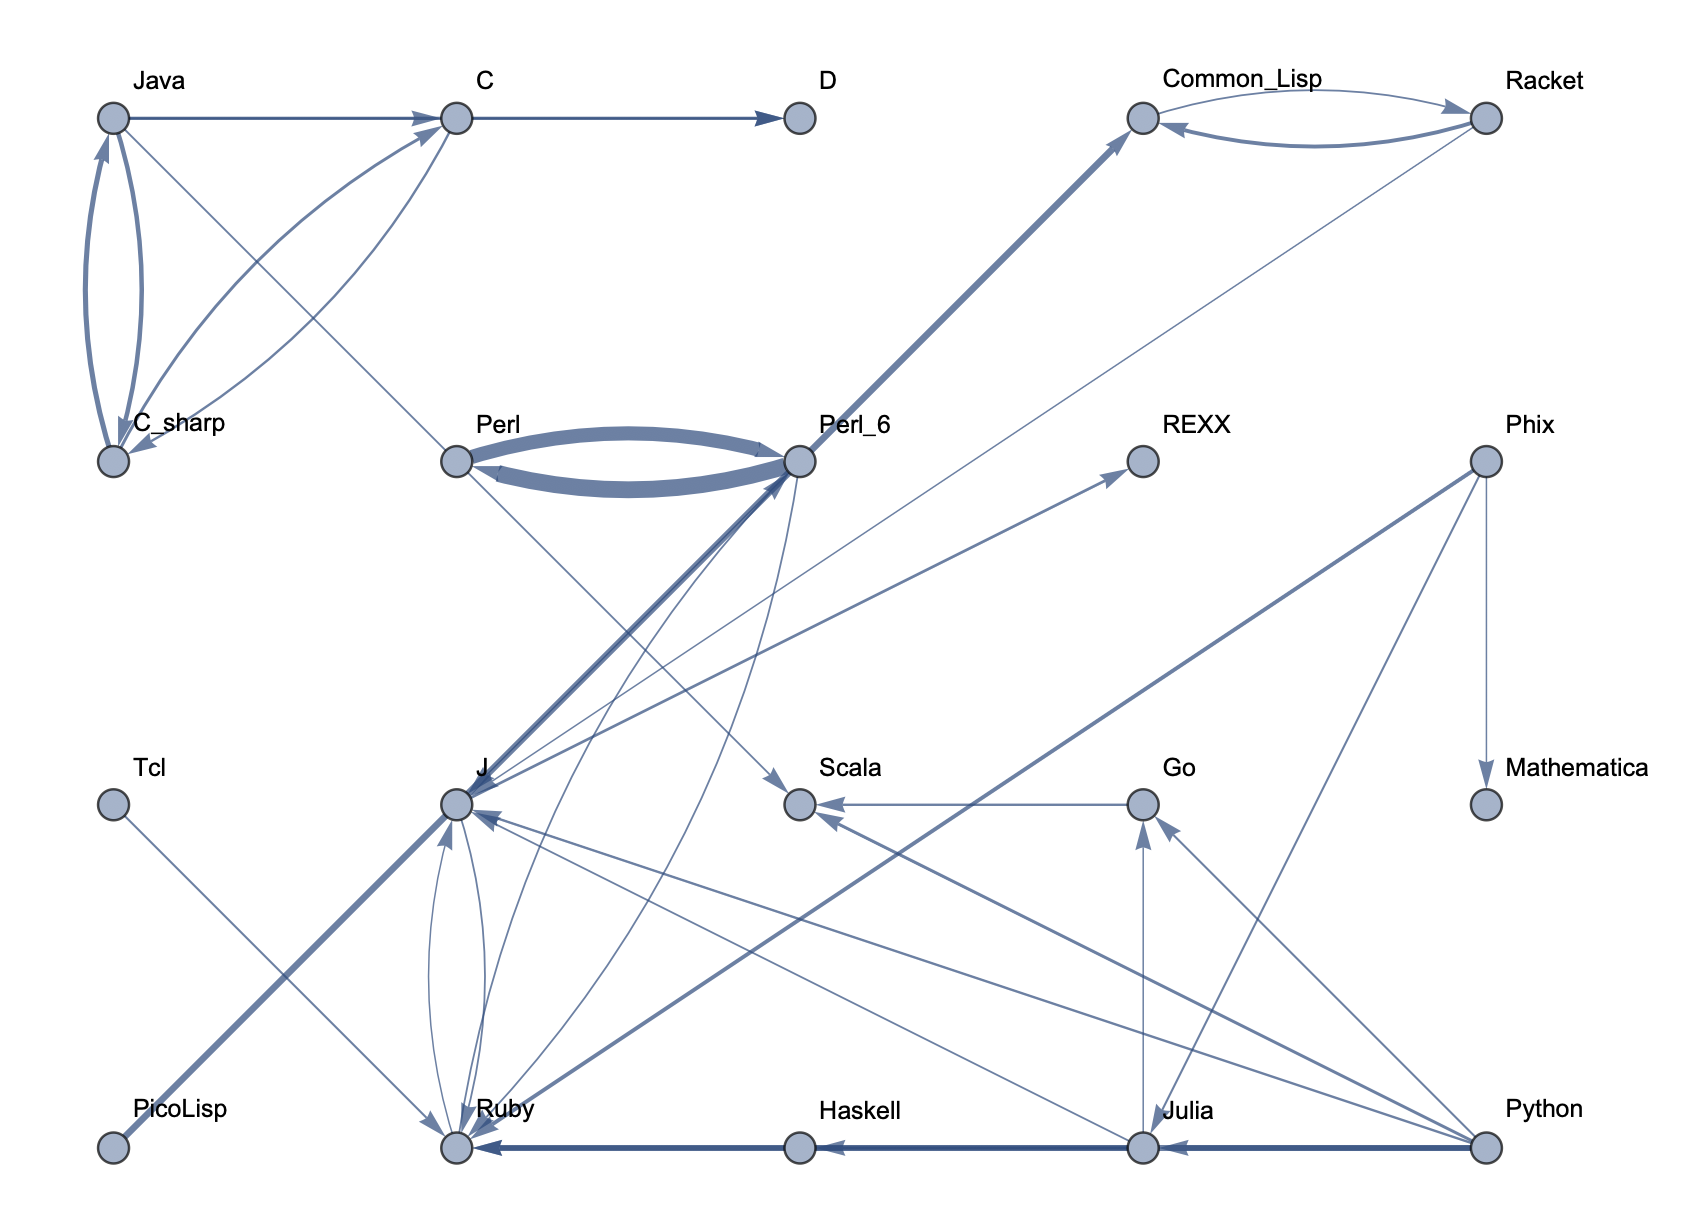 Top 30 Languages: High Threshold
 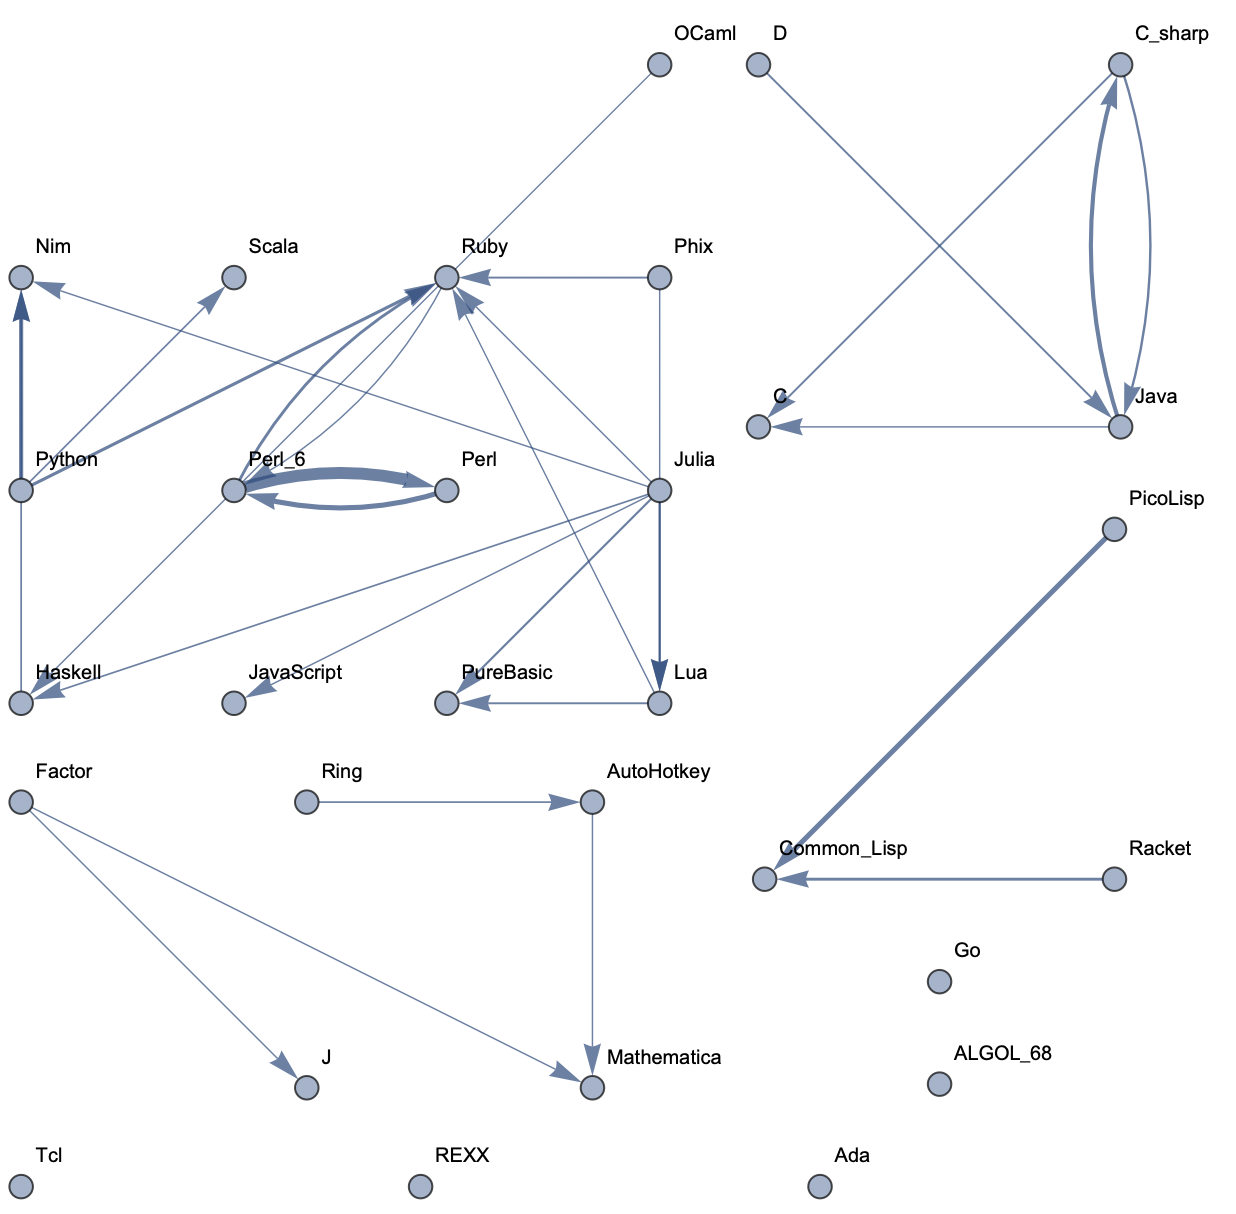 Top 30 Languages: Low Threshold
 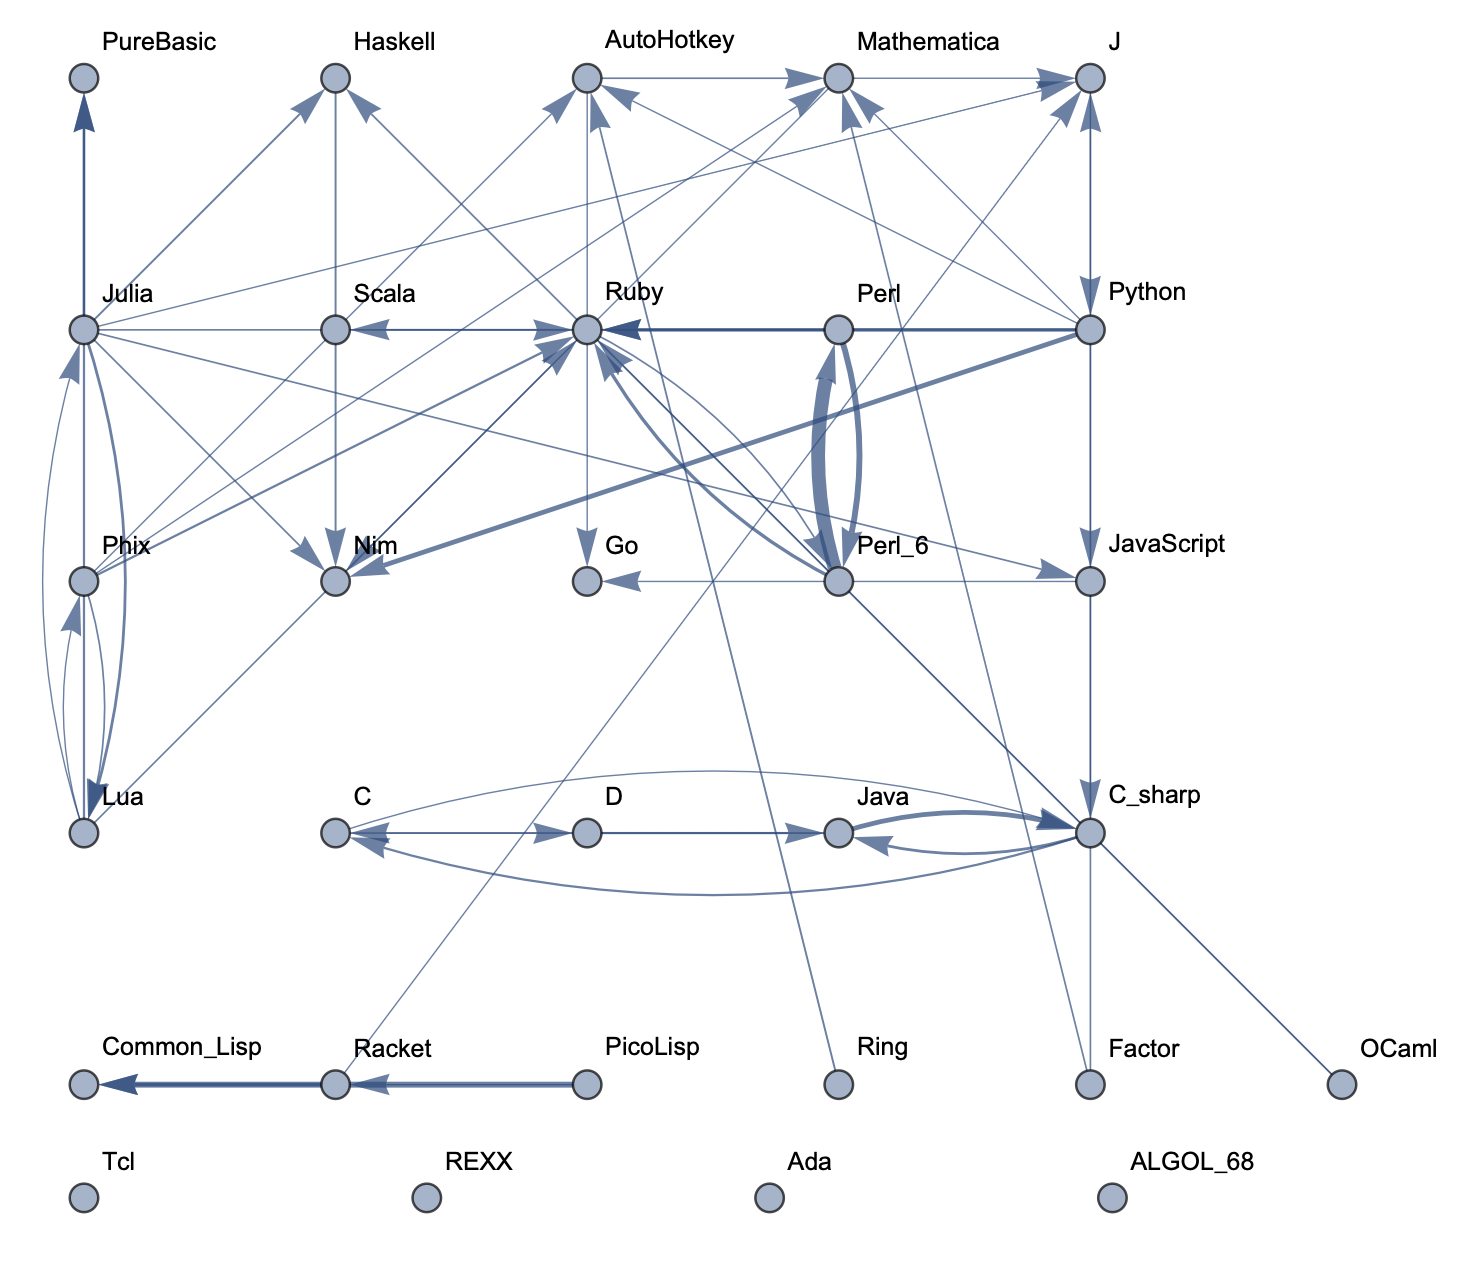 Top 50 Languages: High Threshold
 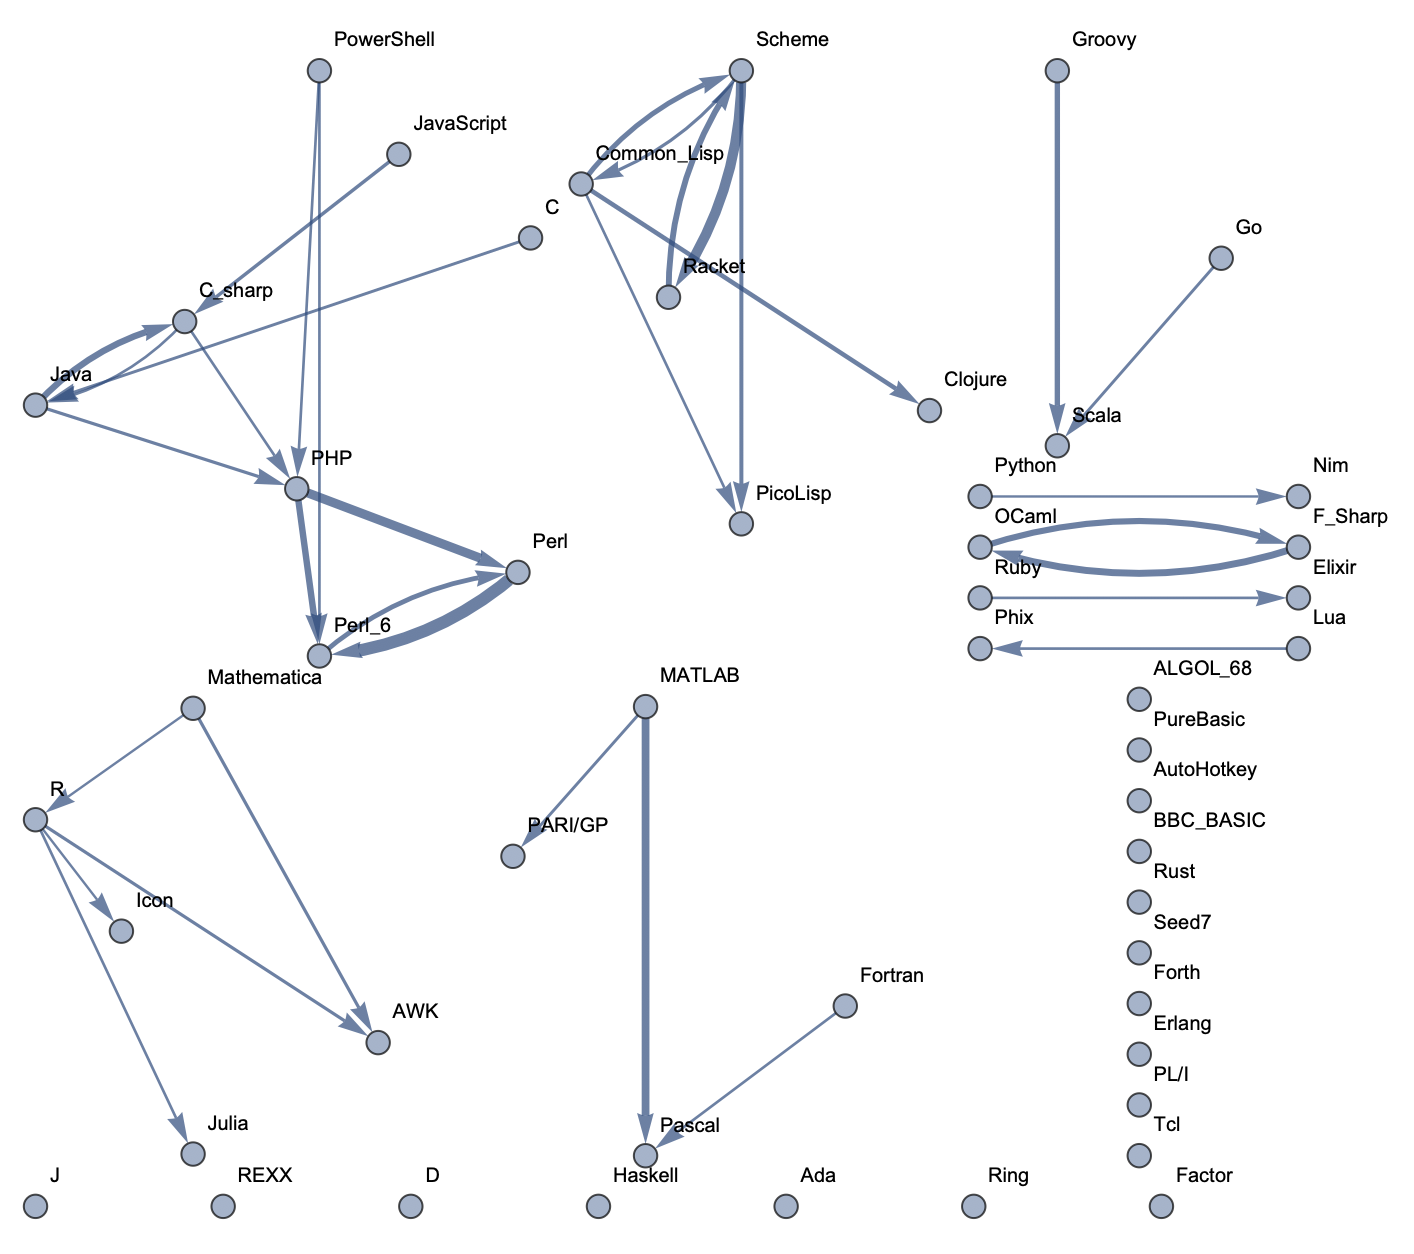 Top 50 Languages: Low Threshold
 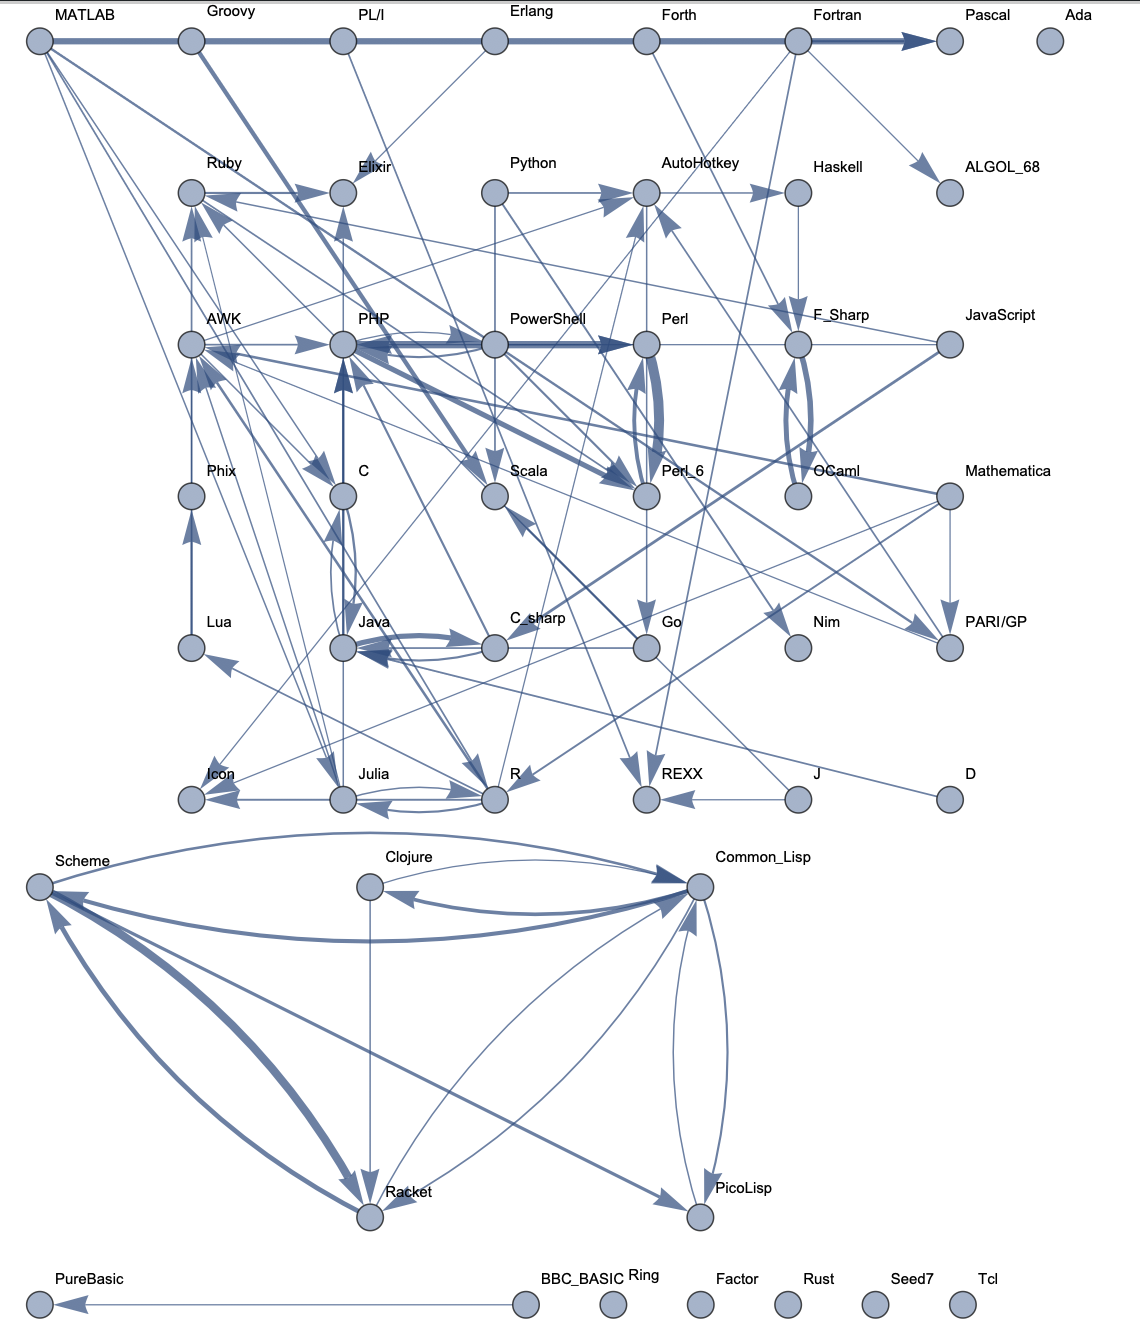 Top 100 Languages: High Threshold
 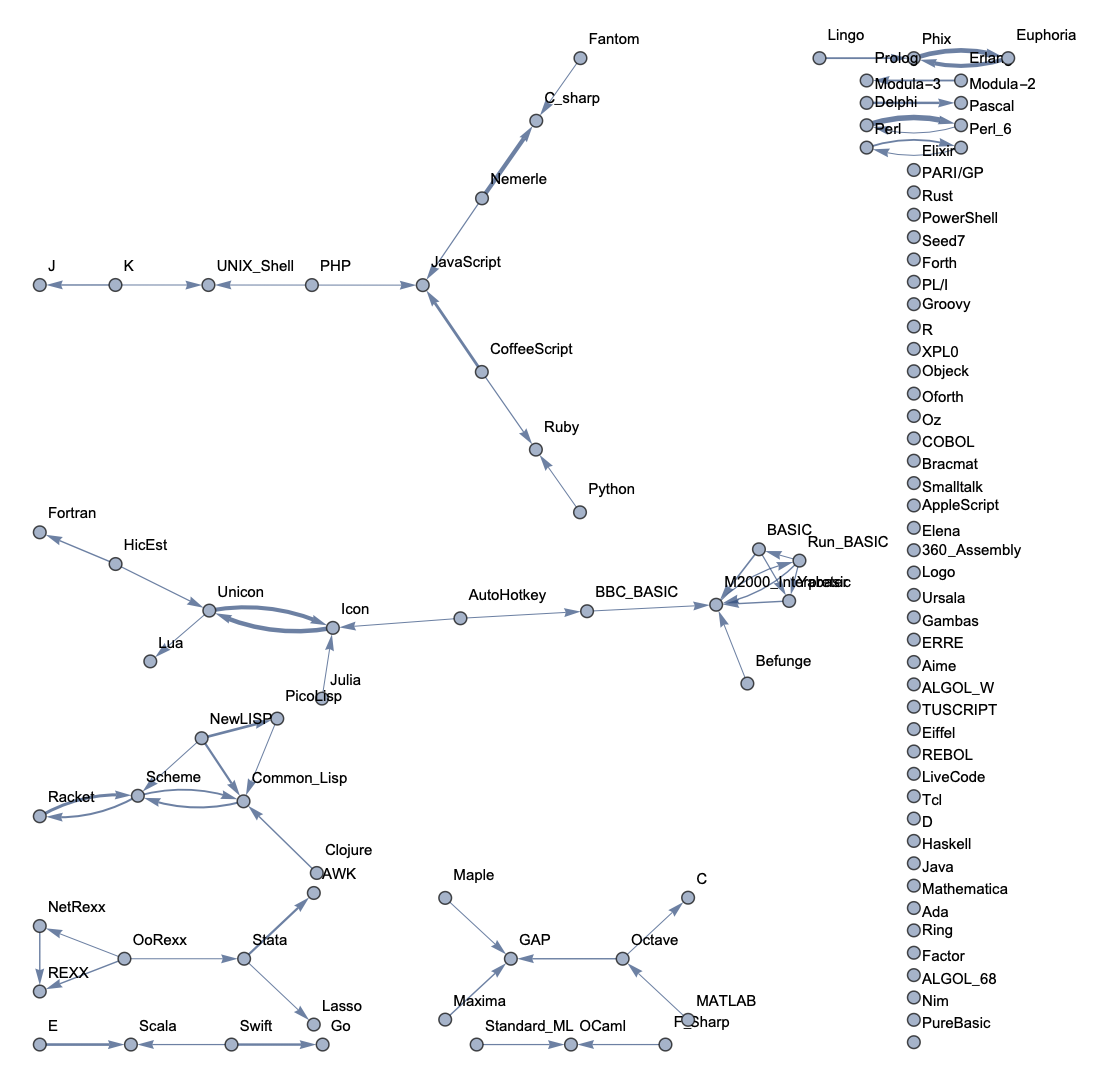 Top 100 Languages: Low Threshold
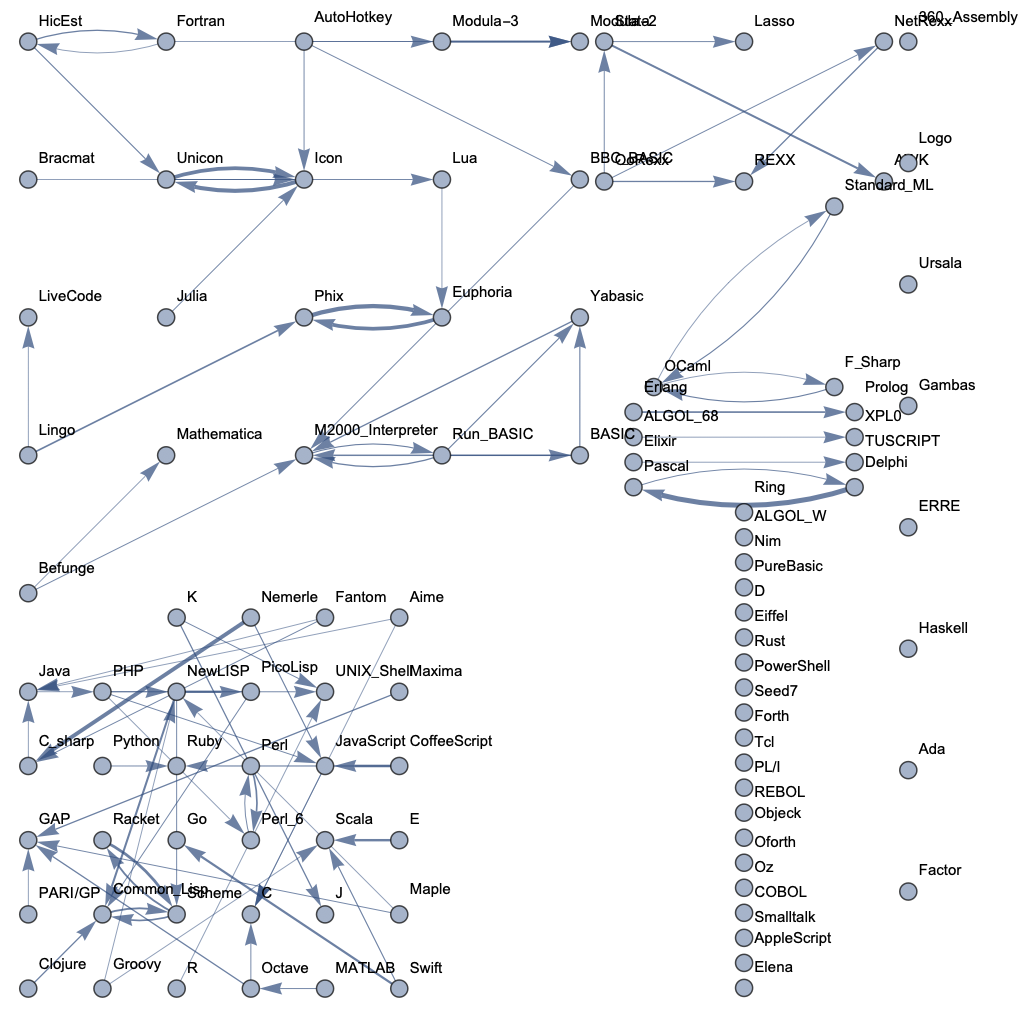
Future Explorations
The results from the generated graphs were reasonable and promising, suggesting that similar methods could be used for larger datasets and fields. While the historical influences of programming languages on each other are relatively well known, this could potentially help in finding relationships in writing, music, and even art, both in the past and in the present. Machine learning is capable of handling larger amounts of data than what is available with computer languages, and it would likely scale well for these broader fields.
Links to Data
The full notebook and extracted code can be found in my GitHub repository PhylogeneticGraphs. All data can be found at Rosetta Code.
Acknowledgements
Thank you to my mentor, Nikki Sigurdson, and to everyone -- including Mads Bahrami, Philip Maymin, Christian Pasquel, and more -- at the 2019 Wolfram Summer Camp who helped teach me the Mathematica language and worked with me on coding and debugging. Also a big thank you to Stephen Wolfram and all of the organizers for organizing the camp and providing me with this opportunity.
Thank you to Jon McLoone for showing how to extract code from the Rosetta Code website in his blog on comparing code lengths Code Length Measured in 14 Languages, and thank you to Rosetta Code and its contributors for providing all of the data.
 Attachments:


