I've taken this piece of code from the documentation:
data = Table[Sin[i + j], {j, 0, 2 Pi, 0.5}, {i, -1, 1}];
ListDensityPlot[data, Mesh -> All]
I am working in something similar, but I want to make the ListDensityPlot to cover the full rectangle showed in the plot (no white space). Can anyone help me?
ListDensityPlot
Thank you in advance for any help!
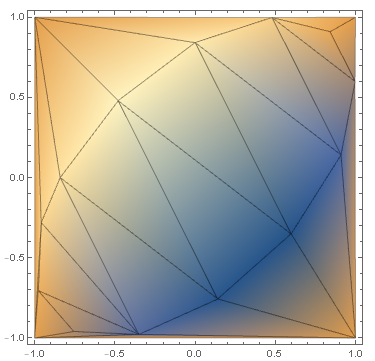
OK. Try by adding corner points to the list:
data = Table[Sin[i + j], {j, 0, 2 Pi, 0.5}, {i, -1, 1}];
corners = {{-1, -1, 0}, {1, -1, 0}, {1, 1, 0}, {-1, 1, 0}};
ListDensityPlot[Join[data, corners], Mesh -> All]
Ok, I don't know why but using InterpolationOrder->0 it works.
InterpolationOrder->0
Yes, InterpolationOrder->0 does make the plot cover the whole square. But then it looks a bit strange:
Yes, it's true. It looks a bit weird. However, in my case study it seems to fit well.
It'd be nice if there were an option to full the rectangle with a higher interpolation order though.
data = Table[Sin[i + j], {j, 0, 2 Pi, 0.5}, {i, -1, 1}];
ListDensityPlot[data, Mesh -> All,  Prolog -> {Blue, Rectangle[{-1, -1}, {1, 1}]}]
Thank you for your answer!
I was thinking about an extension of the interpolation done to cover the full rectangle.