Message Boards Message Boards

0
|
4102 Views
|
1 Reply
|
0 Total Likes
View groups...
Share
Share this post:

[?] Convolution of a normal distribution and a partially defined function?

Posted 5 years ago

Hello, everybody, in order to fit a distribution that I recently recorded in the course of a series of measurements, I need the convolution of these two equations (as fit function). Unfortunately I don't manage to calculate this convolution with Wolframalpha and the error "Standard computation time exceeded..." appears every time.

The two functions are:
1) e^(-(x)^2), 2)
2) sqrt(1+(1/(1-x^2)))

The convolution integral then results in :
int [(sqrt(1+(1/(1-x^2)))) (e^(-(u-x)^2)) dx]

My input at Wolframalpha is the following:
int [(sqrt(1+(1/(1-x^2)))) (e^(-(u-x)^2)) dx from -0.5..0.5]
Because function 2 is periodic I have set limits for the Wolframalpha Code:
I know that there is also a command for convolution , but it should do the same.

Maybe one of you can help me out and explain my mistake. That would be a great help.
Thank,
M

POSTED BY: Mitch Mayerhofer
 Integrate[Sqrt[1 + 1/(-x^2 + 1)]*Exp[-(u - x)^2], {x, -1/2, 1/2}]
(* Returns an input,Mathematica dosen't know the answer.*)

When Mathematica returns the input as the output, it means that the calculation returned unevaluated. This often means that the function does not have the methods available to solve the problem symbolically, or it is mathematically impossible to obtain a symbolic solution (not all sums, integrals, or differential equations have symbolic solutions after all).

With numerics we able a plot solution:

g[u_?NumericQ] := NIntegrate[Sqrt[1 + 1/(-x^2 + 1)]*Exp[-(u - x)^2], {x, -1/2, 1/2}]
Plot[g[u], {u, -3, 3}]
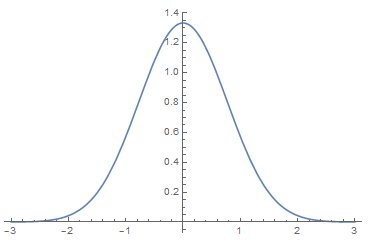
enter image description here

By using NonlinearModelFit command we can find a good approximate function:

data = Table[{u , g[u]}, {u, -3, 3, 1/10}] // N;
nlm = NonlinearModelFit[data, a + b*Exp[-c*u^2 + d], {a, b, c, d}, u] // Normal


(* -0.00114935 + 0.399547 E^(1.20727 - 0.846568 u^2) *)

Plot[{g[u], nlm}, {u, -3, 3}, PlotStyle -> {Black, {Dashed, Red}}]
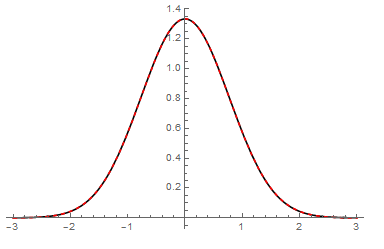
enter image description here

Plot[{g[u] - nlm}, {u, -3, 3}](*Residuals*)
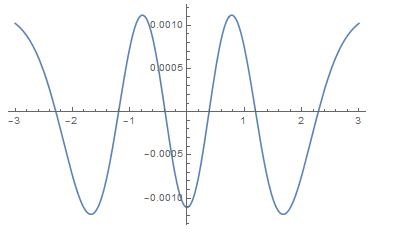
enter image description here

Regards M.I.

POSTED BY: Mariusz Iwaniuk
Reply to this discussion
Community posts can be styled and formatted using the Markdown syntax.
Reply Preview
Attachments
Remove
or Discard

Group Abstract Group Abstract