Hi Dimitris,
Is this what you are trying to do?
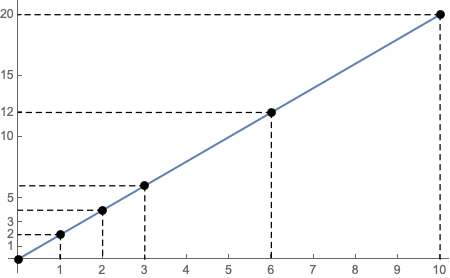
points = {{0, 0}, {1, 2}, {2, 4}, {3, 6}, {6, 12}, {10, 20}};
yAxisPoints = {0, Last[#]} & /@ points;
xAxisPoints = {First[#], 0} & /@ points;
yLines = {Directive[Dashed], Line[#]} & /@ Transpose[{points, yAxisPoints}];
xLines = {Directive[Dashed], Line[#]} & /@ Transpose[{points, xAxisPoints}];

Plot[{2 x}, {x, 0, 10},
 Epilog -> {PointSize[Large], Point[points], yLines, xLines},
 Ticks -> {{0, 1, 2, 3, 4, 5, 6, 7, 8, 9, 10}, {0, 1, 2, 3, 5, 10, 12, 15, 20}}]
I left out the labels