Message Boards Message Boards

Importing tide data for analysis

Posted 5 years ago

Hi There I am very new to Mathematica and having issues just with importing time series data for tides and then looking for guidance on how to analyze it. I have data in Excel (attached) for three time series of measured tide data from three gauge stations; two of them measured at my site (the "Barge" and "Slough" stations) and the third is a NOAA government tide control station in the third worksheet named "Control". My goal is to calculate tide statistics (i.e. MHHW, MHW etc) at my site by reckoning (linear regression) of the short term measured data from my two stations back to the NOAA control station with many years of tide data so better statistics. One import issue is that my measured stations (Barge and Slough) have their date/time in one column in Excel and in the NOAA station, they come in two separate columns. I can do this in Excel but wanting to learn Mathematica better to automate the process which is slow in Excel.

I want to import each dataset and plot them together. Then the part I really could use guidance with is that I have to match each of the four unequal daily tides from the site stations against the control station. The difference in time is about 1 to 2 hours. In other words, I have four tides a day (higher high, high, low and lower low) and I want to extract the matching tides for each measured site against the control site so I would have eight datasets; HHW, HW, LW, LLW for {barge and control} and the {slough and control} sites. Is there a way to identify peaks and lows and match them and then extract the data into datasets? (in Excel I manually inspect and match them up which is very slow) Finally, I need to plot the 8 datasets and then do a linear regression and calculate variance etc from the best fit line.

attached is the datasets in Excel and my start attempt at a notebook. You can see I fall apart quickly, when I import the datasets I cant get them to plot even though Mathematica seems to recognize that they are dates and values.

any help is much appreciated, sorry if this is such a newbie question. Roger

POSTED BY: Roger Leventhal

Here is a start, where the double column dataset is combined I hope correctly, so the datasets will now plot. You have to set the directory to whatever it should be. The signal processing is now back to you.

SetDirectory["/Downloads"];
file = "tide_data_for_analysis_short.xlsx";
bargestationraw = Drop[Import[file, {"Data", 1}], 2];
sloughstationraw = 
 Drop[Drop[Import[file, {"Data", 2}], 
   2], -1]; (* delete missing final entry *)
controlstationdoubleraw =
  Drop[Import[file, {"Data", 3}], 
  2]; (* date and time in columns one and two need to be combined *)

d = Map[DateList, 
   controlstationdoubleraw[[All, 1]]][[All, {1, 2, 3}]]; (* dates *)
t = 
 Map[DateList, 
   controlstationdoubleraw[[All, 2]]][[All, {4, 5, 
    6}]]; (* times *)
controlstationraw = 
 Transpose[{Map[DateObject, Map[Flatten[#, 2] &, Transpose[{d, t}]]], 
   controlstationdoubleraw[[All, 3]]}];

Map[Dimensions, {bargestationraw,
  sloughstationraw,
  controlstationraw}] (* check data sets have suitable dimensions *)

{{4855, 2}, {2700, 2}, {9840, 2}}

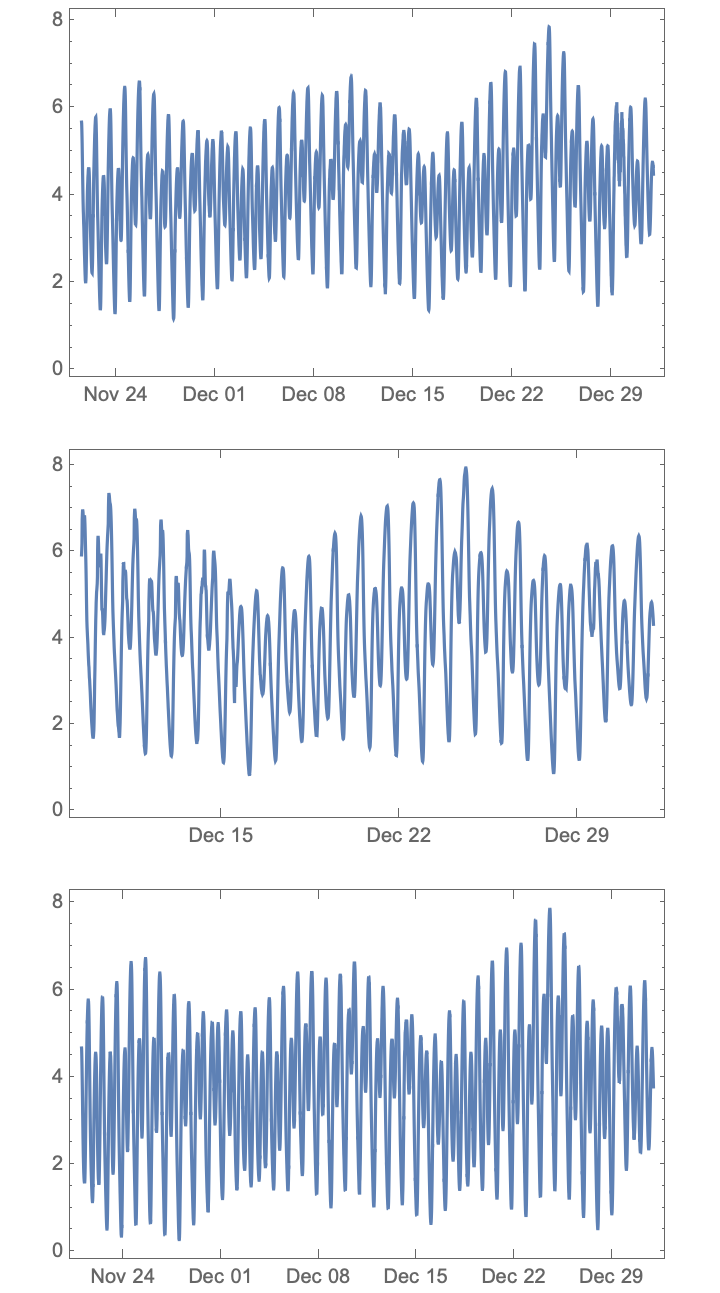
GraphicsColumn[Map[DateListPlot, {bargestationraw,
   sloughstationraw,
   controlstationraw}]]

Tide Plots

Reply to this discussion
Community posts can be styled and formatted using the Markdown syntax.
Reply Preview
Attachments
Remove
or Discard

Group Abstract Group Abstract