Group Abstract Group Abstract

Message Boards Message Boards

0
|
3.1K Views
|
2 Replies
|
3 Total Likes
View groups...
Share
Share this post:

[?] Plot y=3xy - xy^2 + c?

Posted 6 years ago

I know that I can break this up into parts and plot them individually, but I'm wondering if there is a way to just plot this without having to do that?

POSTED BY: DJ Seaton
2 Replies

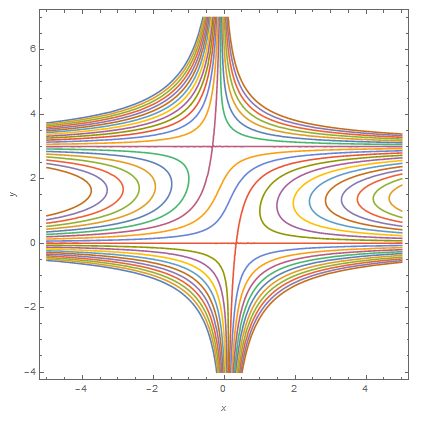
In this case c is a integer from -10..10:

ContourPlot[y == 3 x y - x y^2 + 1, {x, -5, 5}, {y, -4, 7}, FrameLabel -> Automatic](*If c=1 *)

ContourPlot[Evaluate@Table[y == 3 x y - x y^2 + c, {c, -10, 10}], {x, -5, 5}, {y, -4, 7}, FrameLabel -> Automatic]

enter image description here

Regards M.I.

POSTED BY: Mariusz Iwaniuk
Posted 6 years ago

Thank you very much, M.I.!

POSTED BY: DJ Seaton
Reply to this discussion
Community posts can be styled and formatted using the Markdown syntax.
Reply Preview
Attachments
Remove
or Discard