Update to my efforts:
Starting with a subset of my original data:
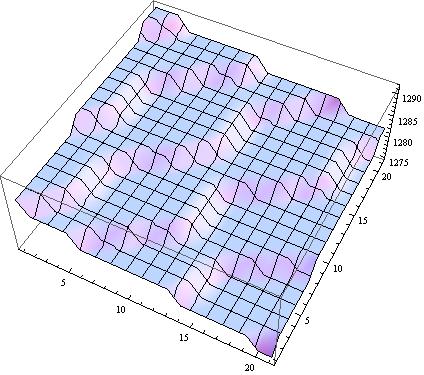
Using some built-in filters with Mathematica I've been able to "isolate" the islands more or less with the following code:
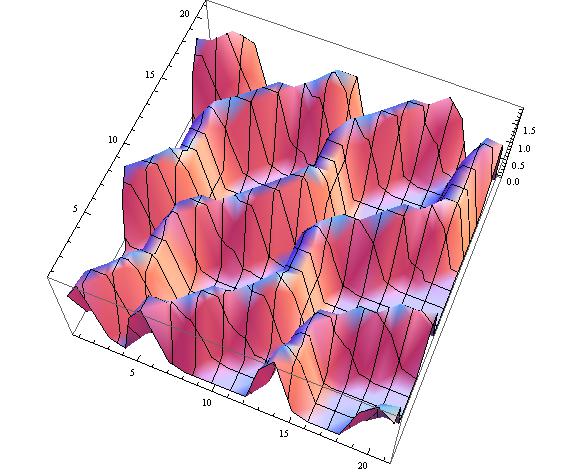
gswla = GradientFilter[swla, 1];
This gives me a gradient matrix of the initial square matrix I was using.
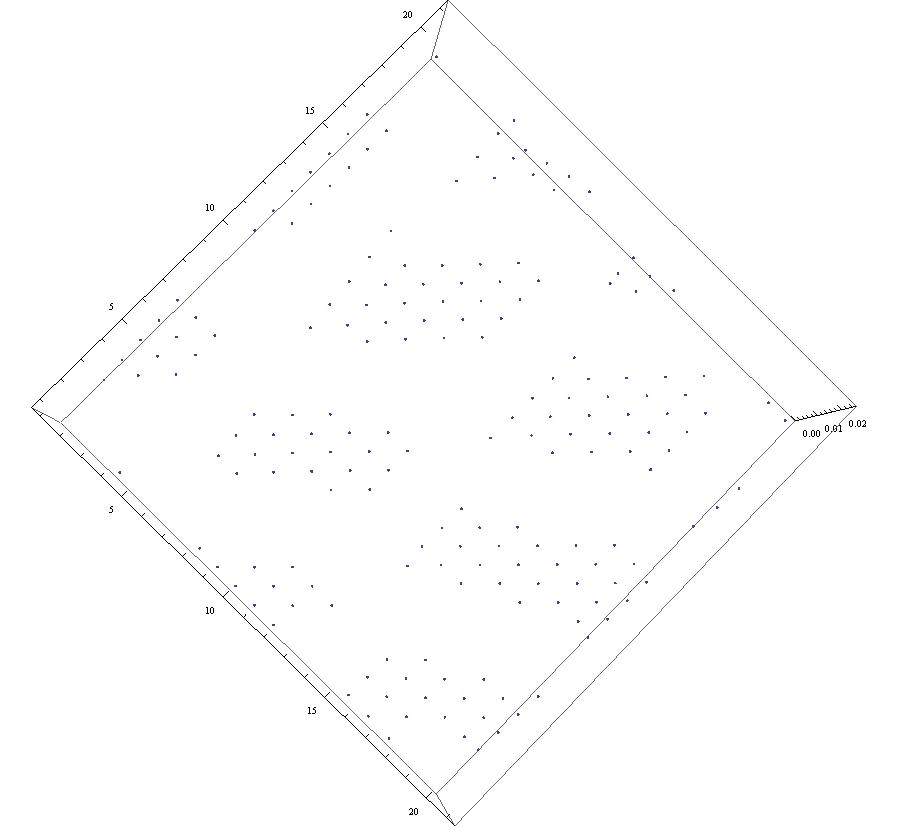
 Next, I went through the matrix and put Null on anything above a threshold value that is known for this type of data.
Table[If[gswla[[i, j]] < thresh, gswla[[i, j]], Null], {i, 1,
   Dimensions[gswla][[1]]}, {j, 1, Dimensions[gswla][[2]]}];
This then gives me a plot of all the "Islands" isolated by "no man's land"
It is easier to see in MatrixForm:
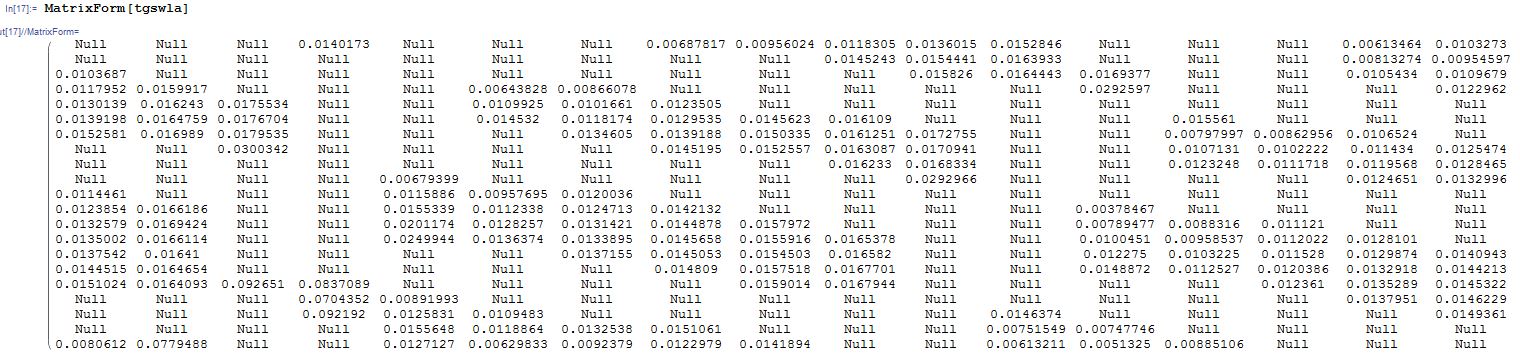
So using this "isolated" data, how can I group these islands into their own distinguishable cluster? I figure I can use the matrix coordinates for each cluster in the gradient matrix to identify the counterpart in the original data set.
Thanks!!!


