Some hashtags on the social image-sharing network Instagram have gone somewhat viral. The two that I use here are "#selfiesunday," which involves taking a photo of oneself on a Sunday and "#throwbackthursday" or "#tbt," which involves posting a picture of oneself from their past on a Thursday. Both these hashtags involve days of the week, and variations can be made such as "#selfietuesday" and "#throwbackwednesday." I took statistics from the Instagram search and made bar graphs for each of these phenomena covering all days of the week and "#tbt"-type acronyms.
The "#selfiesunday" analysis was quite straightforward. The code used follows:
selfie = {5562997 + 41069 + 37999 + 19635 + 7752 + 3262,
138536 + 3290, 101829, 67855, 72681, 104998, 759679 + 11878};
BarChart[selfie,
ChartLabels -> {"Sunday", "Monday", "Tuesday", "Wednesday",
"Thursday", "Friday", "Saturday"}, ScalingFunctions -> "Log"]
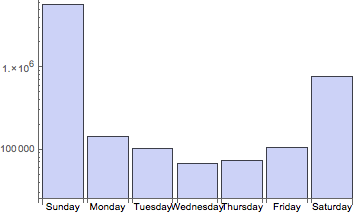
The variable "selfie" contains post counts for different hashtags for days of the week. Multiple addends account for variations in the hashtag such as "#selfiesundays" and "#selfiesundayyy." I accounted for all of these variations down to 5000 posts. The graph had to be plotted on a log scale because the original hashtag was much more popular than the variations, and a linear plot would have diminished the variations to an unreadable level. The resulting graph follows:

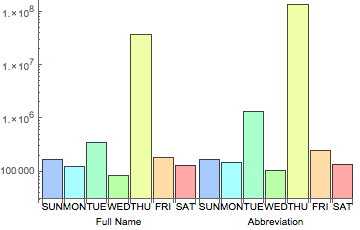
The "#throwbackthursday" graph was more complex for two reasons. One, I had to include both full hashtag names, such as "#throwbackthursday" and sometimes more-used acronyms, like "#tbt." Two, some acronyms, such as "#tbt," can represent two days of the week, Tuesday and Thursday in this case. The other scenario is "#tbs" for Sunday and Saturday. Also, I cannot account for alternate meanings of the acronym. I solved the first problem simply with a multi-series graph. For the second I used a weighted RandomChoice. The RandomChoice was weighted with the post counts of each of the two possible days, and I Table'ed it over the post count of the acronym. I then Count'ed the results and used them as the post counts for the acronyms. The code and graph follow:
throwback = {{158687 + 5432, 119419 + 5096, 342816 + 10122,
82899, 34538975 + 1222803 + 252837 + 157518, 173771 + 6478,
130427}, {169790, 144941, 1293641, 105580, 132526223, 241935,
134165}};
Count[
Table[RandomChoice[{352938, 36172133} -> {tues,
thurs}], {133819864}], tues];
Count[
Table[RandomChoice[{164119, 130427} -> {sun, sat}], {303955}], sat];
BarChart[throwback,
ChartLabels -> {{"Full Name", "Acronym"}, {"SUN", "MON", "TUE",
"WED", "THU", "FRI", "SAT"}}, ScalingFunctions -> "Log"]

More information is available upon request.