I found the graph generated by the function I sent to the Wolfram Function Repository:
ResourceFunction["AlternateElements"]
and the integers very interesting. I take two equal lists of integers, then I convert the numbers to base 2 (binary) and use AlternateElements, then return the numbers to base 10 to generate the graph with the following function:
patt[n_] :=
 Module[{rlen, alter, resul, list = IntegerDigits[Range@n, 2]},
  rlen = Range@Length@list;
  alter = Table[
    ResourceFunction["AlternateElements"][list[[i]], list[[j]]], {i,
     rlen}, {j, rlen}];
  resul =
   Flatten@Table[
     Table[FromDigits[(alter[[s]])[[k]], 2], {k, 1,
       Length[alter[[s]]]}], {s, 1, Length@alter}];
  ListPlot[resul, ImageSize -> Medium]]
Using this function with the following examples:
{patt[300], patt[425]}
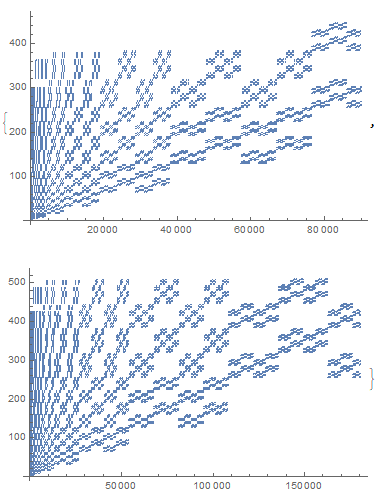
These graphics remind me of some tablecloth, wallpaper, or tile pattern. The pattern always comes out at 8 when the numbers used are base 2.
By generalizing the above function to several bases I could see how the pattern changes:
patt[n_, base_] :=
 Module[{rlen, alter, resul, list = IntegerDigits[Range@n, base]},
  rlen = Range@Length@list;
  alter =
   Table[ResourceFunction["AlternateElements"][list[[i]],
     list[[j]]], {i, rlen}, {j, rlen}];
  resul =
   Flatten@Table[
     Table[FromDigits[(alter[[s]])[[k]], base], {k, 1,
       Length[alter[[s]]]}], {s, 1, Length@alter}];
  ListPlot[resul, ImageSize -> Medium]]
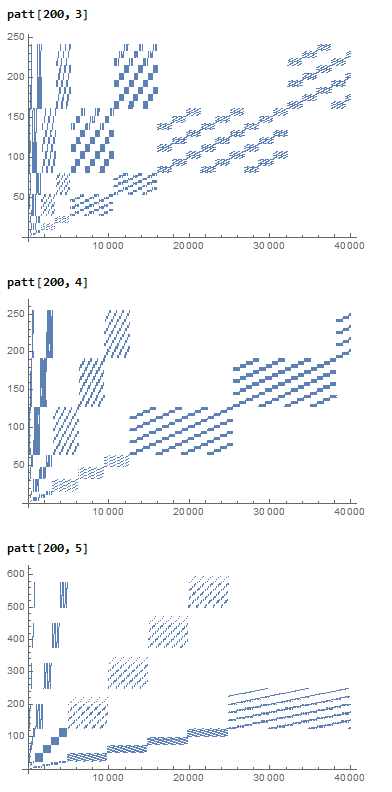
Above, I used the function with numbers in bases 3, 4 and 5. The smallest pattern is repeated {base^3} times, while the largest pattern is repeated {base-1} times, but I still don't know the exact reason for that.
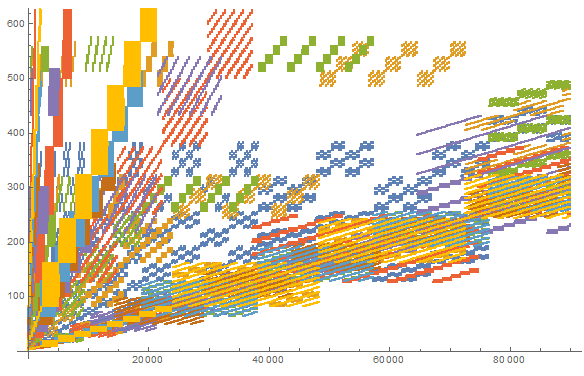
In this other graph are the curves from base 2 to base 9 simultaneously on the same graph:
With this other function (below) we can alternate lists of integers between different bases (base1 and base2) and convert the result to another base (baser) to have new and different patterns:
patt[n_, base1_, base2_, baser_] :=
 Module[{rlen1, rlen2, , alter, resul,
   list1 = IntegerDigits[Range@n, base1],
   list2 = IntegerDigits[Range@n, base2]}, rlen1 = Range@Length@list1;
   rlen2 = Range@Length@list2;
  alter = Table[
    ResourceFunction["AlternateElements"][list1[[i]], list2[[j]]], {i,
      rlen1}, {j, rlen2}];
  resul =
   Flatten@Table[
     Table[FromDigits[(alter[[s]])[[k]], baser], {k, 1,
       Length[alter[[s]]]}], {s, 1, Length@alter}];
  ListPlot[resul, ImageSize -> Medium]]
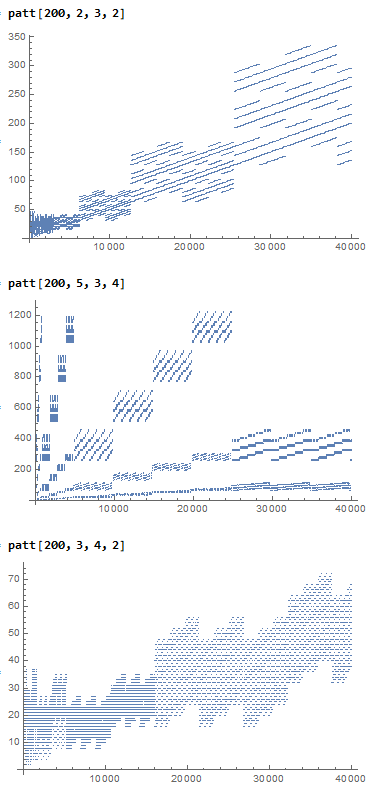
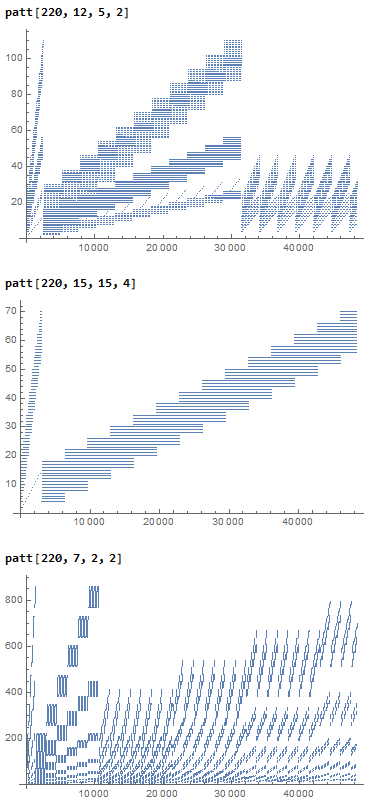
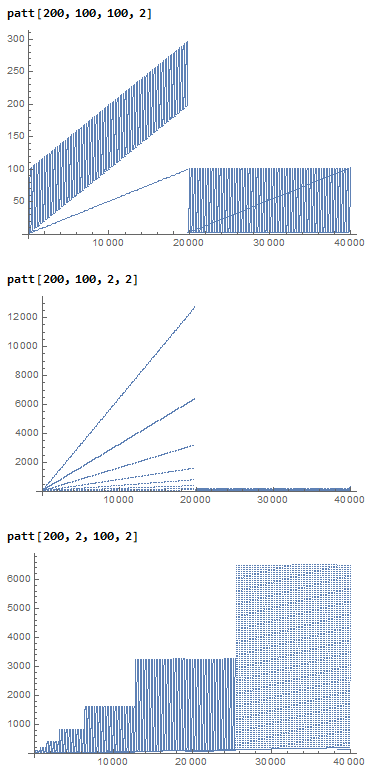
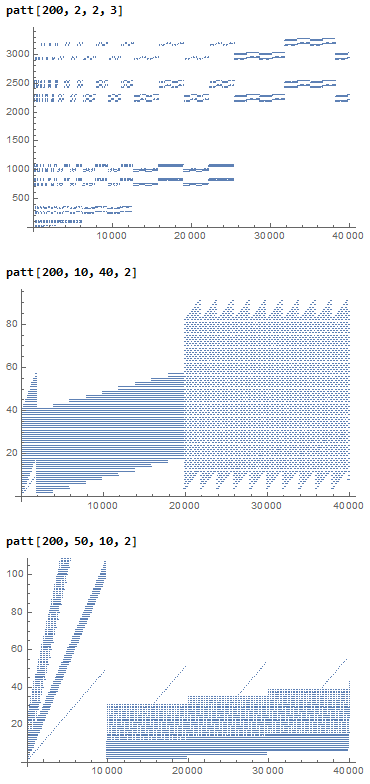
With the above function, there are several possibilities for new curve patterns, we just have to test the many variations of the input base and the output base. These were just a few examples.


