History:
Nested Base Shift Convergence sequence (NBSC sequence: A326653-OEIS, author: Claudio Lobo Chaib Filho, Sep 12 2019), is an example of how Mathematica is a powerful and very useful tool for new creations, as I developed this sequence using Mathematica and after that was complemented by Michel Marcus, Sep 13 2019 with PARI script.
For this reason I believe it is interesting to share with the community some things about it, such as: definition, code in Wolfram Language, graphics...among other things.
Sequence Definition:
...gives the the constant term of the convergence of a number n into a base sequence conversion nest:
nestb[n_, b_] :=
  Module[{i},
   Nest[i = 1; FromDigits[IntegerDigits[#, 1 + i++], 1 + i++] &, n,
    b]];

Making this nest for any integer n: ...FromDigits(IntegerDigits(FromDigits(IntegerDigits(n,2),3),4),5)..., each step of the nest is an iteration of type: ...FromDigits(IntegerDigits(n,s),s+1)..., with the initial s with the value 2, that is, for example, in the first iteration, the number n is converted to base 2, so it is brought to base 10 as if it came from base 3. The next iteration repeats this operation, but converts the result of previous step to base 4 and takes it to base 10 from base 5, and so on until the number does not change when a new step is made.
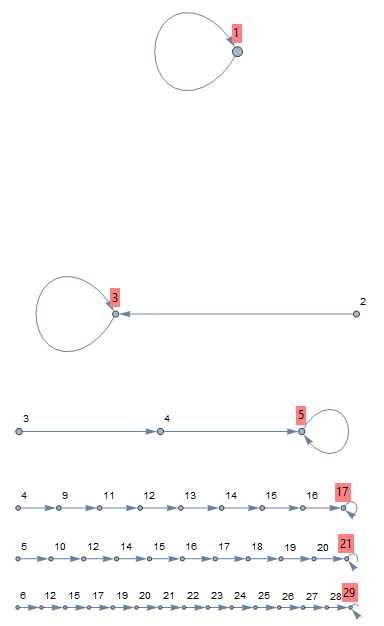
The number 1 is the first term because, since the first iteration, when n=1, the result is 1, and 1 on any basis is itself, so a(1)=1. The number 3 is a term because when n=2, the first iteration represented by: FromDigits(IntegerDigits(2,2),3) gives 3 and the second iteration: FromDigits(IntegerDigits(3,4),5), it still gives 3, that is, in any subsequent iteration, the result for n=2 continues to give 3, so a(2)=3. The number 5 is a term because when n=3, after the second and subsequent iterations the result is 5, then a(3)=5 and so on.
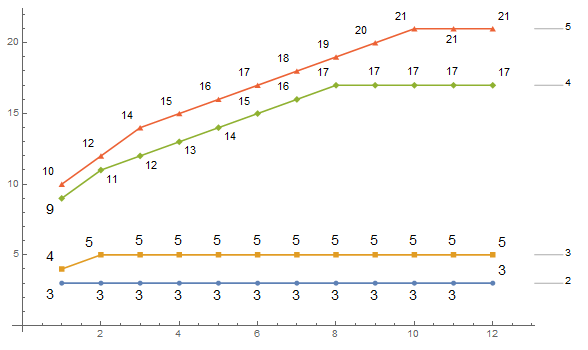
Graphs that exemplifies these sequences of operations for the first numbers:
ListLinePlot[
 Table[Table[Labeled@nestb[n, t1], {t1, 1, 12}], {n, 2, 5}],
 LabelingSize -> 13, PlotMarkers -> Automatic,
 PlotLabels -> {"2", "3", "4", "5"}, ImageSize -> Large]
NBSCstepgraph[n_] :=
  Module[{i, j},
   label[l_] :=
    Panel[l, FrameMargins -> -2, Background -> Lighter[Red, 0.5]];
   NBSC[m_] :=
    FixedPoint[j = 1;
     FromDigits[IntegerDigits[#, 1 + j++], 1 + j++] &, m, Infinity];
   NestGraph[i = 1; FromDigits[IntegerDigits[#, 1 + i++], 1 + i++] &,
    n, 300, VertexLabels -> {"Name",
      NBSC[n] -> Placed["Name", Above, label]}]];

Do[Print@NBSCstepgraph[x], {x, 1, 6}]
Data:
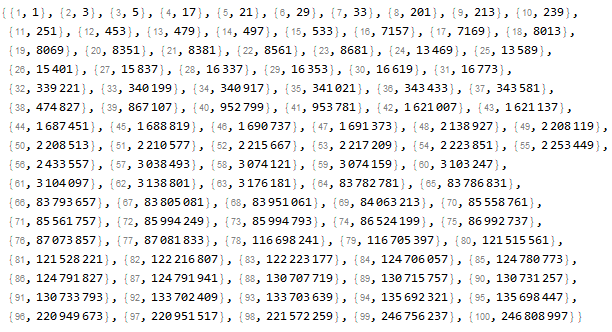
The NBSC sequence is formed by the constant terms generated by this formula:
NBSC[n_] :=
  Module[{i},
   FixedPoint[i = 1; FromDigits[IntegerDigits[#, 1 + i++], 1 + i++] &,
     n, Infinity]];

range = Range@100;
tab = Table[{Text[Style[range[[j]], Gray, Small]], NBSC[j]}, {j, 1,
   Length@range}]
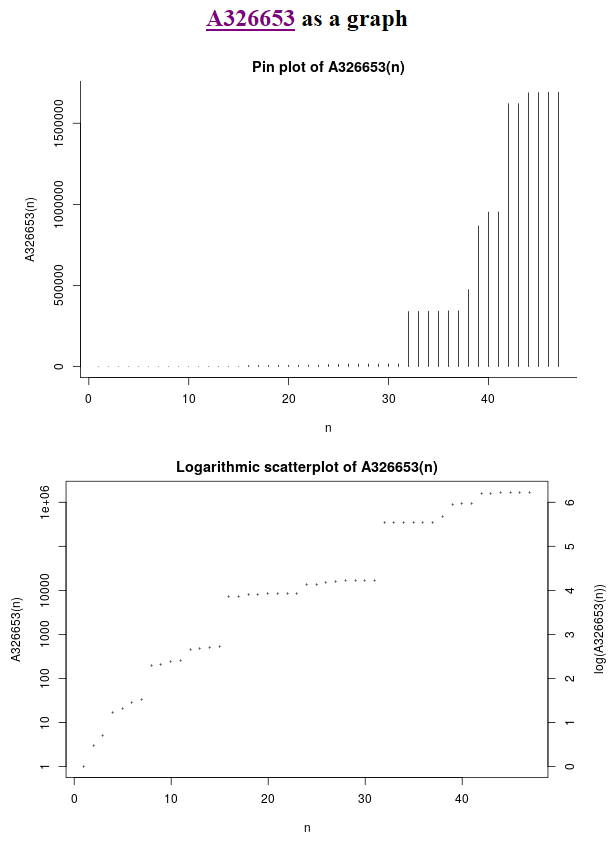
Generated charts (BarChart + OEIS):
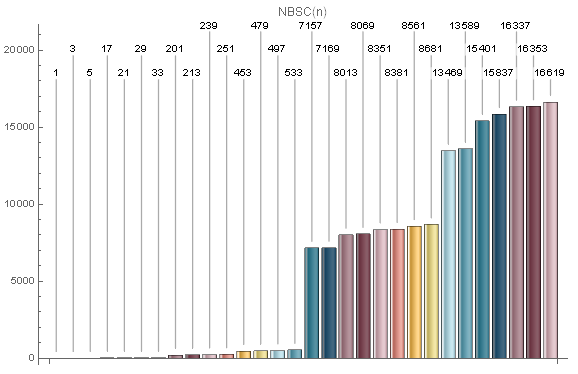
c1 = {1, 3, 5, 17, 21, 29, 33, 201, 213, 239, 251, 453, 479, 497, 533,
    7157, 7169, 8013, 8069, 8351, 8381, 8561, 8681, 13469, 13589,
   15401, 15837, 16337, 16353, 16619};

BarChart[c1, ImageSize -> Large,
 ChartElementFunction -> "GlassRectangle", PlotLabel -> "NBSC(n)",
 ChartStyle -> 24, LabelingFunction -> (Callout[#1, Automatic] &)]
OEIS charts:
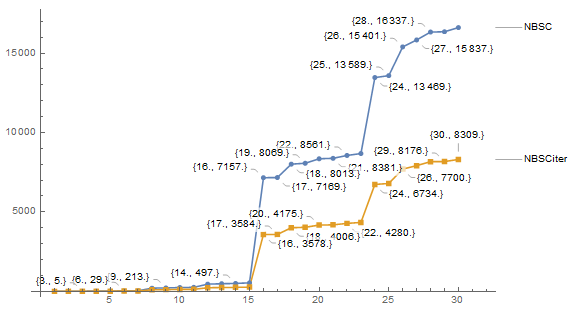
The number of iterations required to calculate each NBSC term is given with the formula below (this formula is slower than the term calculation formula):
NBSCiter[n_] :=
  Module[{s, i}, s = 1;
   While[True,
    If[Nest[i = 1; FromDigits[IntegerDigits[#, 1 + i++], 1 + i++] &,
       n, s] ==
      FixedPoint[i = 1;
       FromDigits[IntegerDigits[#, 1 + i++], 1 + i++] &, n, Infinity],
      Break[]]; s++]; s];

range = Range@30;
tab = Table[{Text[Style[range[[j]], Gray, Small]], NBSCiter[j]}, {j,
   1, Length@range}]

c2 = {1, 1, 2, 8, 10, 14, 16, 100, 106, 119, 125, 226, 239, 248, 266,
   3578, 3584, 4006, 4034, 4175, 4190, 4280, 4340, 6734, 6794, 7700,
   7918, 8168, 8176, 8309};

ListLinePlot[{c1, c2}, ImageSize -> Large,
 LabelingFunction -> (Callout[#1, Automatic] &),
 PlotMarkers -> Automatic, PlotLabels -> {"NBSC", "NBSCiter"}]
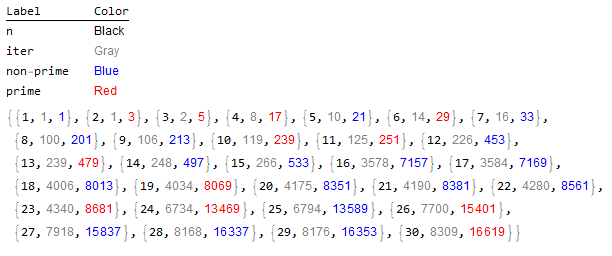
Detailed table of terms and iterations of each term:
allseq[n_] :=
  Module[{j2, j3, h1, h2, h3}, j2 = Table[NBSCiter[i], {i, 1, n}];
   j3 = Table[NBSC[j], {j, 1, n}]; h1 = Range[n];
   h2 = Table[Text[Style[j2[[q]], Gray, Medium]], {q, 1, Length[j2]}];
    h3 = Table[
     If[PrimeQ[j3[[p]]] == True, Text[Style[j3[[p]], Red, Medium]],
      Text[Style[j3[[p]], Blue, Medium]]], {p, 1,
      Length[j3]}]; {Print@
     TableForm[{{"n", Text[Style["Black", Black, Medium]]}, {"iter",
        Text[Style["Gray", Gray, Medium]]}, {"non-prime",
        Text[Style["Blue", Blue, Medium]]}, {"prime",
        Text[Style["Red", Red, Medium]]}},
      TableHeadings -> {None, {"Label", "Color"}}],
    Print@Thread[{h1, h2, h3}]}];

allseq[30]
Link: https://oeis.org/A326653
Thanks.