Group Abstract Group Abstract

Message Boards Message Boards

Get real names and locations of weather stations?

Hi,

I got all weather stations list easily using the below command.

Is it possible to get the real names or even locations of these stations?

enter image description here

Thank you very much.

POSTED BY: M.A. Ghorbani
8 Replies
Posted 6 years ago

Hi Mohammad,

allWeatherStations // First // EntityProperties // CanonicalName
(* {"Coordinates", "EntityClasses", "Latitude", "Longitude", "Name", "Position"} *)

Get the value of the Position property for a random sample and remove those for which no position data is available.

samplePositions = 
 allWeatherStations // RandomSample[#, 50] & // EntityValue[#, "Position"] & // DeleteMissing

Plot them

samplePositions // GeoListPlot[#, GeoBackground -> "CountryBorders"] &

enter image description here

You may want to keep the associated entity, in which case

allWeatherStations // RandomSample[#, 50] & // Map[{# -> EntityValue[#, "Position"]} &]

I don't know how to get the name of the weather station. The Name property returns a code name.

POSTED BY: Rohit Namjoshi
Posted 6 years ago

Hi Mohammad,

A mapping between weather station identifier codes and location is available here. You could also use WL to find the nearest city to the position. Multiple stations could map the the same city though.

SeedRandom[12];
samplePositions =
  allWeatherStations //
  RandomSample[#, 50] & //   
  Map[{# -> EntityValue[#, "Position"]} &] //  
  DeleteCases[#, {_ -> _Missing}] & //
  Map[#[[1, 1]] -> Flatten@{#[[1, 2]], GeoNearest["City", #[[1, 2]]]} &]

samplePositions // Take[#, 5] & // InputForm // Column[{#}] &

(*
{Entity["WeatherStation", "ESSV"] -> {GeoPosition[{57.663000000000004, 18.346}], Entity["City", {"Visby", "Gotland", "Sweden"}]},
 Entity["WeatherStation", "NGFO"] -> {GeoPosition[{-5.667, 176.133}], Entity["City", {"Lolua", "Nanumea", "Tuvalu"}]},
 Entity["WeatherStation", "KSSF"] -> {GeoPosition[{29.337, -98.471}], Entity["City", {"SanAntonio", "Texas", "UnitedStates"}]}, 
 Entity["WeatherStation", "WMO94520"] -> {GeoPosition[{-28.979, 148.99}], Entity["City", {"Moree", "NewSouthWales", "Australia"}]},
 Entity["WeatherStation", "CWQK"] -> {GeoPosition[{48.298, -123.532}], Entity["City", {"Sooke", "BritishColumbia", "Canada"}]}}
*)
POSTED BY: Rohit Namjoshi

Hi Rohit,

You are unbelievable.

Your help is kindly appreciated.

Mohammad

POSTED BY: M.A. Ghorbani

Hi Rohit,

Please have a look at Fig.1 in the enclosed file. The authors have used several thousand rivers around the World.

Regarding your last suggestion for deriving weather stations name and location on the World map, I decided to study air temperature and rainfall record for all weather stations in allWeatherStations command. What do you think? Is it possible? How do I get data for all station during 2010-2018?

Thank so much again.

Mohammad

Attachments:
POSTED BY: M.A. Ghorbani
Posted 6 years ago

Hi Mohammad,

Technically this is possible, the big problem is that data is incomplete. e.g. for the station above ESSV in the city of {"Visby", "Gotland", "Sweden"}

properties = {"MeanTemperature", "TotalPrecipitation"};
data = WeatherData[Entity["WeatherStation", "ESSV"], #, {{2010, 1, 1}, {2018, 12, 31}, "Month"}] & /@ properties;
DateListPlot[data, PlotLegends -> properties]

enter image description here

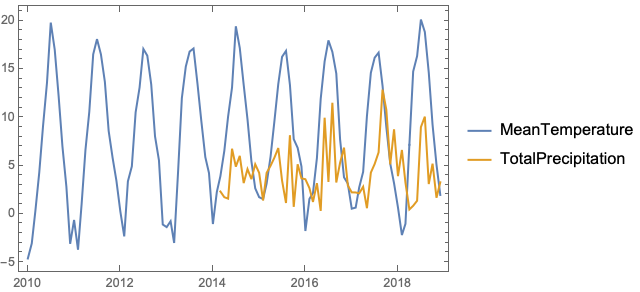
Precipitation data is only available from 2014. For every station the properties and date range for which there is data is different. The coverage is certainly better for larger cities in Europe and USA. I would pick a list of cities you are interested in and see if the data you need is available. e.g.

tabriz = CityData["Tabriz"] // First;
tabrizStation = Entity["WeatherStation", WeatherData[tabriz, "NearestStation"]];

Instantaneous data is available

WeatherData[tabrizStation, #] & /@ {"WindSpeed", "Temperature"}
(* {Quantity[7.56, ("Kilometers")/("Hours")], Quantity[13, "DegreesCelsius"]} *)

but historical data is not

WeatherData[tabrizStation, #, {{2010, 1, 1}, {2018, 12, 31}, "Month"}] & /@ properties
(* {Missing["NotAvailable"], Missing["NotAvailable"]} *)

You may need to use other sources of weather data and import. They are not free but you may be able to access for free if it is for research and non-commercial use. e.g. https://openweathermap.org/price#history

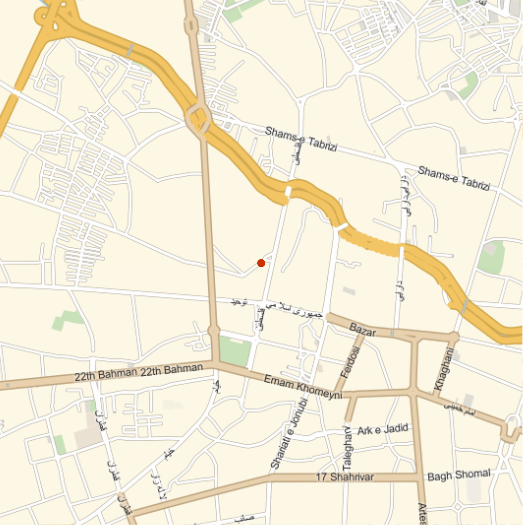
Recognize the location?

tabrizStation // EntityValue[#, "Position"] & // GeoListPlot[#, GeoBackground -> "StreetMap", GeoRange -> Quantity[2, "Kilometers"]] &

enter image description here

POSTED BY: Rohit Namjoshi

Dear Rohit,

Thank you so much again. Your help is greatly appreciated.

Now we have two options:

Drawing the time series for all stations and selection of station (stations) based on the completeness of the data by looking at the plots, OR, selection of large cities based on your solution way. Which one do you prefer the most? Is there any way to draw time series plots for several stations (for example 20 stations) with the station name on the plots?

I am going to start to gather the data for all stations.

Thank you so much again for your time.

Regards, Mohammad

POSTED BY: M.A. Ghorbani

Hi Rohit,

We made some minor change in the notebook. Please see the attached file. How do I have a table based on the alphabetic order of Countries names? enter image description here

Thank so much.

Attachments:
POSTED BY: M.A. Ghorbani
Posted 6 years ago

Hi Mohammad,

Let us continue this exploration over email. If we come up with something interesting / useful to a wider audience we can publish it here or in the Notebook Archive. I will email you later today or tomorrow.

Rohit

POSTED BY: Rohit Namjoshi
Reply to this discussion
Community posts can be styled and formatted using the Markdown syntax.
Reply Preview
Attachments
Remove
or Discard