I have some data (latitude, longitude, data). I hope to use GeoSmoothHistogram to show the geographical distribution and the gradient of the data value. However, the actual execution result does not correctly display the gradient of the data value. The result I hope is not the density of the geographical distribution, but the value of the data. Can someone help me?
rawdata = Import["C:\\Users\\data\\geo_data.csv", {"CSV", "Data"}, HeaderLines -> 1];
GeoSmoothHistogram[GeoPosition[rawdata],PlotLegends -> Automatic]
Output result 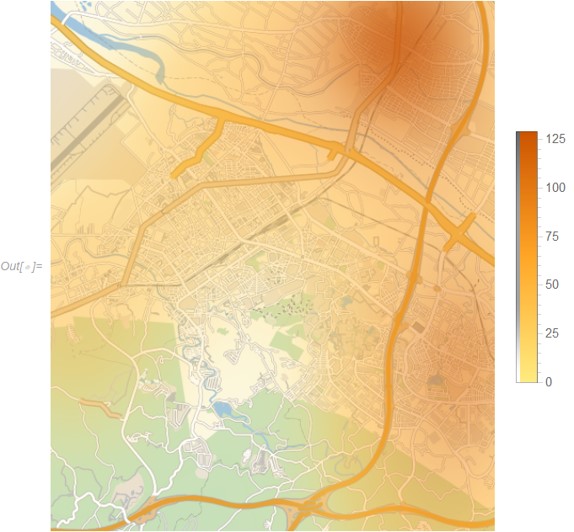
 Attachments:


