I created the following test for young learners to check their understanding of x-y coordinates: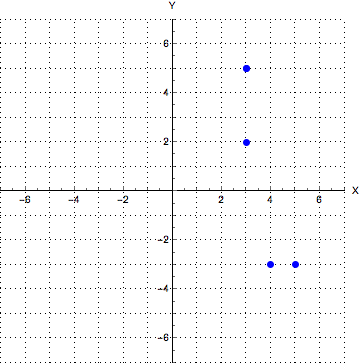
aif[] := RandomInteger[{-6, 6}]
Graphics[{PointSize[Large], Blue, Point[Table[{aif[], aif[]}, 5]]},
 Axes -> True, AxesLabel -> {"X", "Y"}, AxesStyle -> Black,
 GridLines -> {Range[-7, 7, 1], Range[-7, 7, 1]},
 GridLinesStyle -> Dotted, PlotRange -> {{-7, 7}, {-7, 7}}]
Firstly, I would like to add Dynamic Locator for learners to check their answers by navigating to each point and reading it's coordinates. Can anybody help, pls?
Secondly, How can I label these points using letters A,B,C,D,E?
The routine is the following: complete the task, submit the answers, check your answers, grade your work. Therefore, I do not want Locator to be available from the beginning but this I will fix myself.
I am quite excited about this type of tasks: students are always tempted to chenge the wrong answers to paint more positive picture about their performance and, therefore, the self assessment / self marking might not be reliable. I do not use peer marking and I try to miminmize time I spent on grading of students' work. The routine above kills more than two birds with one Mathematica code: the answers are submitted, and, therefore, students can be trusted to mark their work. They get the grade swiftly without any cost for me. By marking their work learners can get an idea about the mistakes they have made if any and set individual learning targets. I note in passing I am no longer setting the learning targets for my students or, in plain English, I do not tell my students what they are not good at. I have time to focus on supporting my students and check that they mark their work properly. Overall, marking their work, understanding their mistakes and setting learning targets provides sufficient evidence to evaluate their "behaviour for learning".


