Vladimir,
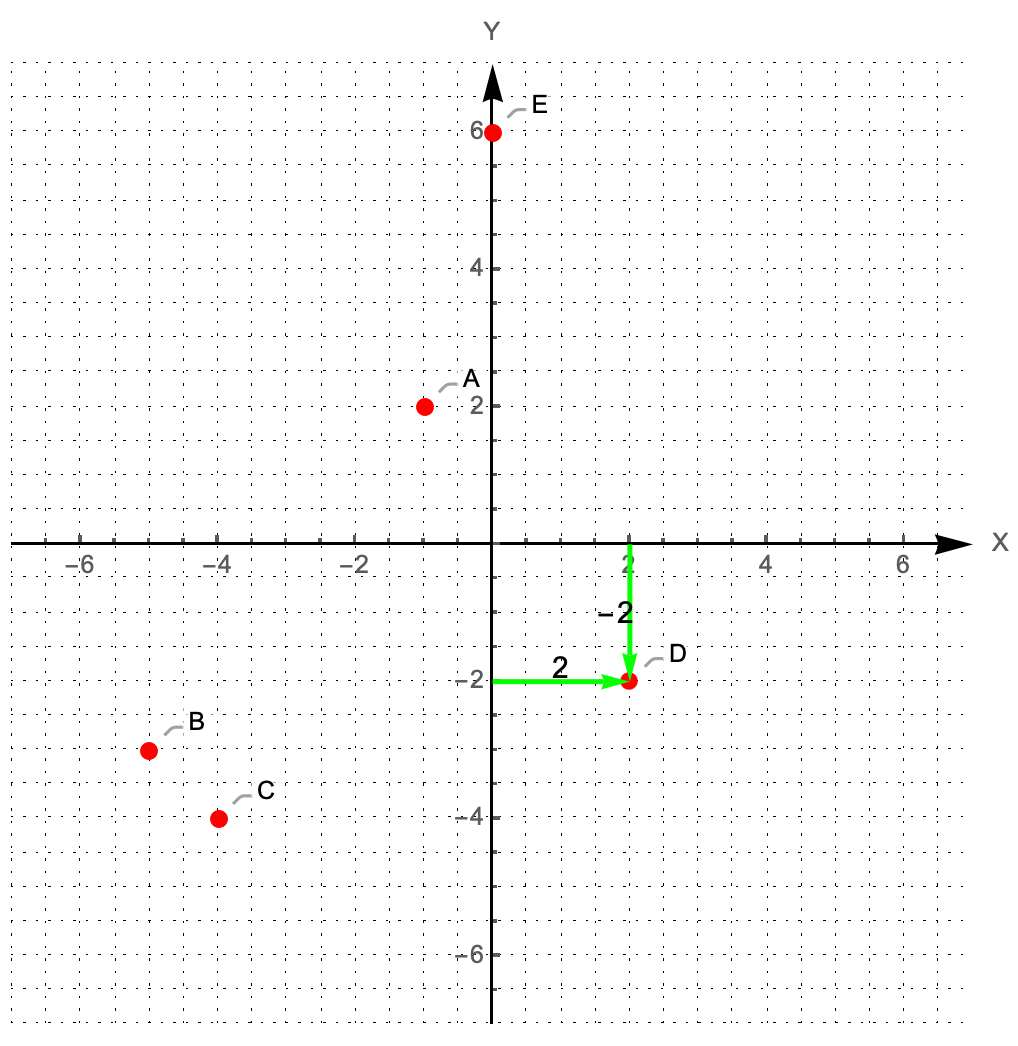
Another option for visualizing the solution is to draw arrows from the axes to the point when the mouse is over a point. e.g
epilog = {Mouseover[
      {PointSize[Large], Red, Point[#]},
      {{Green, Thick, Arrowheads[{0.0, 0.03}], Arrow[{{0, #[[2]]}, #}]},
       {Green, Thick, Arrowheads[{0.0, 0.03}], Arrow[{{#[[1]], 0}, #}]},
       {Style[Text[#[[1]], {#[[1]]/2, #[[2]] + 0.2}], 12, Black]},
       {Style[Text[#[[2]], {#[[1]] - 0.2, #[[2]]/2}], 12, Black]}
       }] & /@ points};
And add Epilog -> epilog to the ListPlot. When the mouse hovers over the {2, -2} point: