Recently I was using WolframCloud to visualize the partial sums of the Dirichlet series underlying the Riemann Zeta function (also known as a p-Series), using Table and Accumulate and feeding the result to ComplexListPlot. At some point I realized that the partial sum coordinates could be represented as an AnglePath, as the lengths and angles of the segments followed a regular pattern based on the real and imaginary components of the input value. I discovered that this method is much faster than the complex exponentiation I was previously doing, enabling me to generate a visualization of thousands of partial sums within seconds.
I figured I would share the function I wrote here in case anyone else finds it useful:
FastZetaPartialSums[s_, count_] := AnglePath[
  {1, 0}, (* starting point, as the first partial sum is always 1 + 0I *)
  Table[{
    n^-Re[s],         (* step length *)
    Im[s]Log[1 - 1/n] (* angle *)
  }, {n, 2, count}]
]
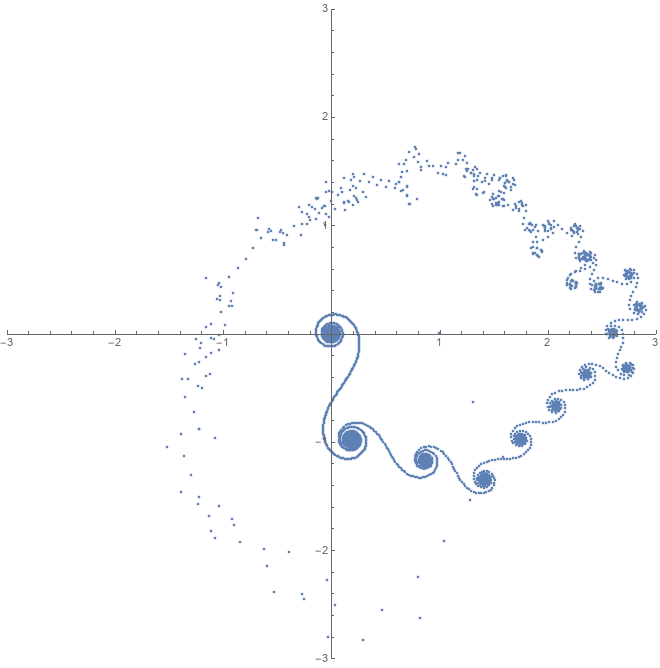
As an example, here's the image generated by running the following code:
ListPlot[
  FastZetaPartialSums[ZetaZero[1, 33704], 6000],
  PlotRange -> {{-3, 3}, {-3, 3}},
  AspectRatio -> 1
]