Group Abstract Group Abstract

Message Boards Message Boards

0
|
3.3K Views
|
4 Replies
|
3 Total Likes
View groups...
Share
Share this post:

Labeling ticks differently on plot axes

Posted 6 years ago

I have a fairly long list of data points that I'm plotting using ListPlot. Now instead of the x axis saying 1000, 2000, 3000,... for the number of the point, I want it to say a, b, c,... how would you do it? The option Ticks inside of ListPlot apparently can only specify at what values I want it to show the respective value, but instead of "1000" I want it to say "a" on the plot axis.

POSTED BY: Daniel Wenczel
4 Replies
POSTED BY: EDITORIAL BOARD
Posted 6 years ago

Crossposted here.

POSTED BY: Rohit Namjoshi
Posted 6 years ago

Hi Daniel,

Is this what you are looking for?

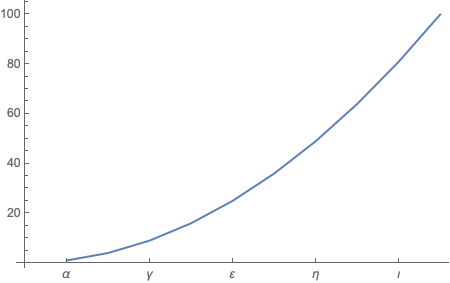
data = Array[{1000 #, #^2} &, 10];
xTicks = Transpose[{data[[All, 1]], Alphabet["Greek"][[1 ;; 10]]}];
ListLinePlot[data, Ticks -> {xTicks, Automatic}]

enter image description here

Since you have a large number of points you may want to only label every n'th one. e.g. for every second one

xTicks = Transpose[{data[[All, 1]][[1 ;; 10 ;; 2]], Alphabet["Greek"][[1 ;; 10 ;; 2]]}];

enter image description here

POSTED BY: Rohit Namjoshi
Posted 6 years ago

Yes that helped a lot, thank you.

POSTED BY: Daniel Wenczel
Reply to this discussion
Community posts can be styled and formatted using the Markdown syntax.
Reply Preview
Attachments
Remove
or Discard