:globe_with_meridians:
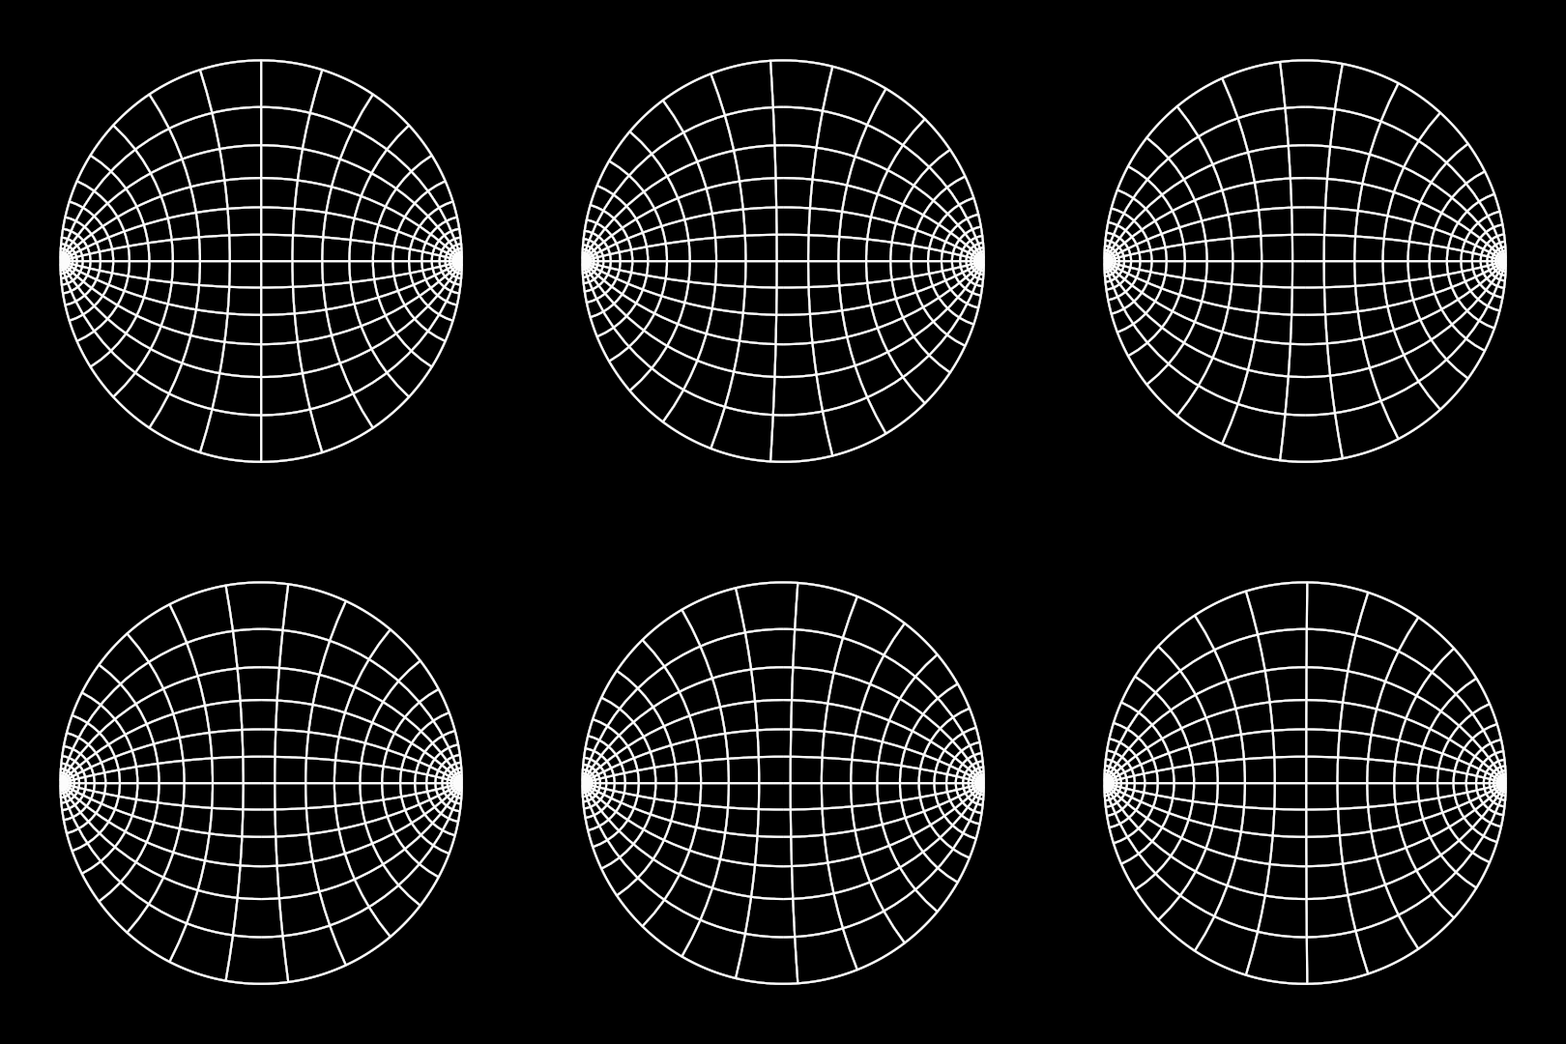
Take level sets of the real and imaginary parts of the level sets of $\frac{1}{\pi i} \log z$ in the upper half plane (i.e., the real part is the standard solution of the Dirichlet problem $\Delta u = 0$, $u(x,0) = 1-\theta(x)$, where $\theta$ is the Heaviside function), then map them by the Cayley transform to the unit disk and you get the static version of this. The motion comes changing the values of the contours of the imaginary part.
In the resulting image, the horizontal circles are level sets of the corresponding Dirichlet problem on the disk, where the boundary value on the upper half of the unit circle is $1$ and on the lower half is $0$. I was using this in my complex analysis class to illustrate how to use conformal transformation to solve boundary value problems; in this case, an electric potential problem on the disk.
Here's the code (of course, I originally used ContourPlot rather than Graphics and Line, but that was much, much slower):
Cayley[z_] := (z - I)/(z + I);

Manipulate[
 Graphics[
  {Thickness[.004], White, Circle[], CapForm[None],
   Table[
      Line[
       Table[ReIm[sign Cayley[r E^(I ?)]], {r, 0., 1, 1/20}]],
      {?, #, ? - #, #}, {sign, {-1, 1}}] &[?/12.],
   Table[
    Line[
     Table[
      ReIm[Cayley[E^((i - t) ?/10) E^(I ?)]], {?, 0., ?, 2 ?/50}]],
    {i, -15, 15, 1}]},
  Background -> Black, PlotRange -> 1.3, ImageSize -> 540,
  Axes -> False],
 {t, 0, 1}]