Hi, I have a problem with the following graphic.
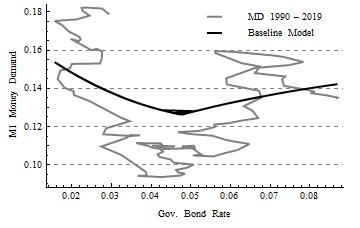
As you can see, the dark line has some issues with values between 0.04 and 0.05. the line comes from the best fit calibration where 3 equations are solved for 3 unknowns numerically. So, my guess is that there is a convergence problem in that interval.
Does anyone know how I can get rid, graphically of that erratic behavior? I know the problem is numerically and it does not affect the results much. however, if I can make the line look better without that multiple values at the middle it would be nice.
I am adding the code in case it may help.
Thanks, a.
 Attachments:


