Hi,
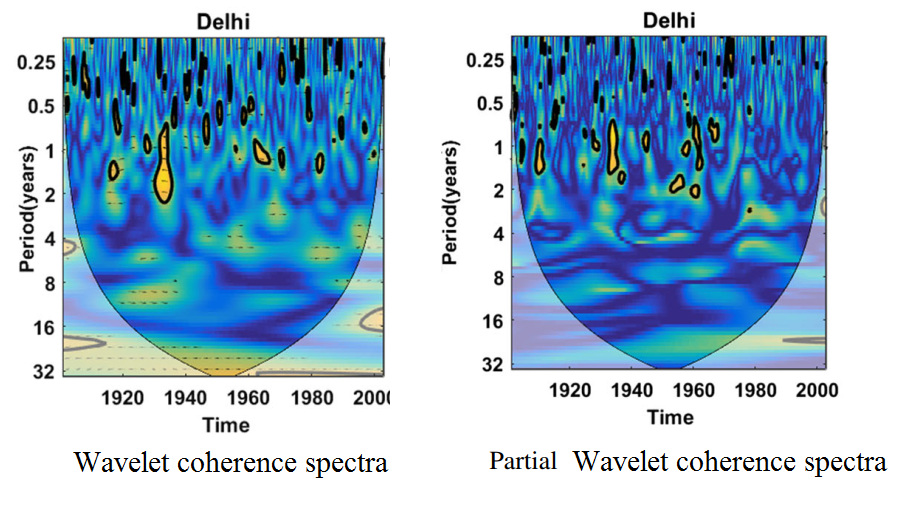
I got the air temperature of Munich for plotting the Wavelet coherence and Partial wavelet coherence with Mathematica. My friend usually draws these kinds of plots in Matlab (see the attached files). I didn't find any library function? How do I do that?
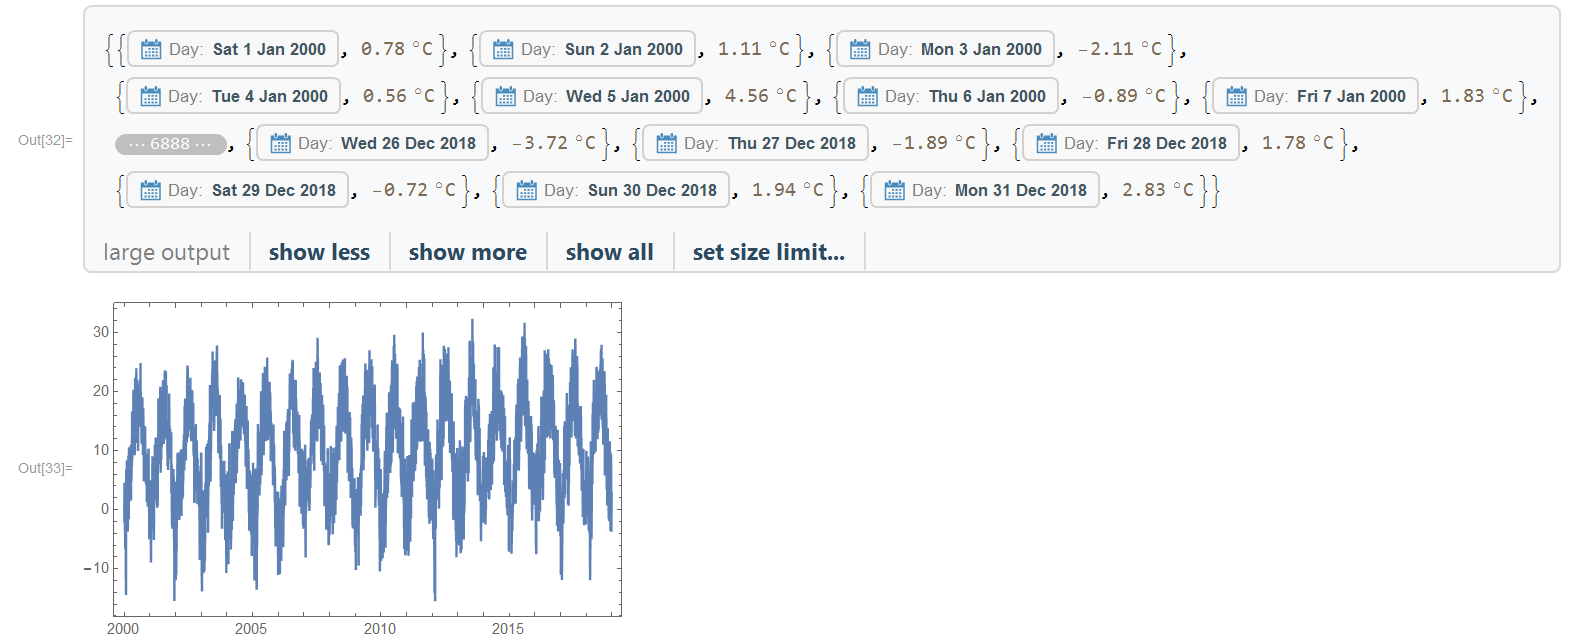
tt0 = WeatherData["Munich", "MeanTemperature", {{2000}, {2018}, "Day"}]

temp0 = Last[tt0\[Transpose]]

Normal[temp0]

DateListPlot[temp0]