I need to integrate DateLispPlot with TimeLinePlotLinePlot. Try to use Show instruction, but although the graphs overlap, the time axis (X-axis), GridLines and DateTicks cannot be properly aligned. Is there a correct way?
ClearAll["Global`*"]
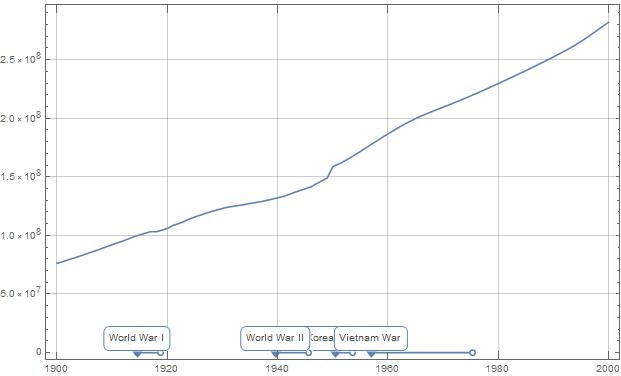
ts = DateListPlot[
CountryData[#, {"Population", {1900, 2000}}] &@"United States",
GridLines -> Automatic];
ww = TimelinePlot[{Entity["HistoricalEvent", "WorldWar1"],
Entity["HistoricalEvent", "WorldWar2"],
Entity["HistoricalEvent", "VietnamWar"],
Entity["HistoricalEvent", "KoreanWarBegins"]},
GridLines -> Automatic];
Show[{ts, ww}]