Message Boards Message Boards

0
|
2929 Views
|
3 Replies
|
1 Total Likes
View groups...
Share
Share this post:

How to integrate DateLispPlot and TimeLinePlot correctly?

I need to integrate DateLispPlot with TimeLinePlotLinePlot. Try to use Show instruction, but although the graphs overlap, the time axis (X-axis), GridLines and DateTicks cannot be properly aligned. Is there a correct way?

ClearAll["Global`*"]
ts = DateListPlot[
   CountryData[#, {"Population", {1900, 2000}}] &@"United States", 
   GridLines -> Automatic];
ww = TimelinePlot[{Entity["HistoricalEvent", "WorldWar1"], 
    Entity["HistoricalEvent", "WorldWar2"], 
    Entity["HistoricalEvent", "VietnamWar"], 
    Entity["HistoricalEvent", "KoreanWarBegins"]}, 
   GridLines -> Automatic];
Show[{ts, ww}]
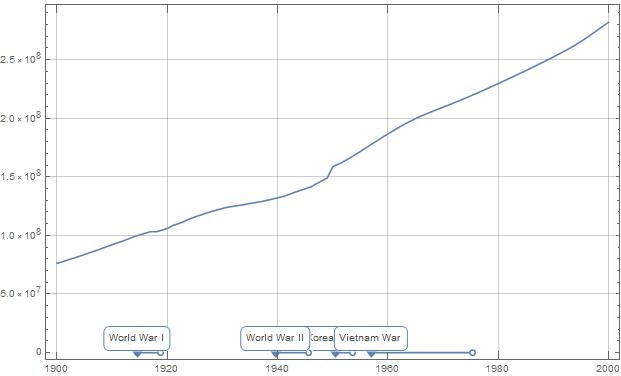
enter image description here

POSTED BY: Tsai Ming-Chou
3 Replies

You just need to adjust your spacings because when you combine the plots, it uses the scaling from the y axis of the population plot:

ts = DateListPlot[
   CountryData[#, {"Population", {1900, 2000}}] &@"United States", 
   GridLines -> Automatic];
ww = TimelinePlot[{Entity["HistoricalEvent", "WorldWar1"], 
    Entity["HistoricalEvent", "WorldWar2"], 
    Entity["HistoricalEvent", "VietnamWar"], 
    Entity["HistoricalEvent", "KoreanWarBegins"]}, 
   GridLines -> Automatic, Spacings -> {2*^7}];
Show[ts, ww, ImageSize -> Large]

to get

enter image description here

Regards,

Neil

POSTED BY: Neil Singer

It turned out so! Sir, You really helped a lot ~ Thank you~~~

POSTED BY: Tsai Ming-Chou

Sir: I used the same method in another example but it didn't work. Is there any other way?

Attachments:
POSTED BY: Tsai Ming-Chou
Reply to this discussion
Community posts can be styled and formatted using the Markdown syntax.
Reply Preview
Attachments
Remove
or Discard

Group Abstract Group Abstract