Message Boards Message Boards

Extracting Data from BodePlot

Posted 4 years ago

Hi!

I am trying to extract the data points from a BodePlot. For example:

bpx = BodePlot[
TransferFunctionModel[{{{20}}, 20 + s}, s]]

This plots the Bode of the transfer funtion. I tried the following:

points = Cases[Normal@bpx, Line[pts_] -> pts, Infinity]

which, returns a table with the points for x and y coordinates. For the values of y-axis, it seems to be right. However, the command is not returning the correct values for x-axis.

Thanks!

Lucas

POSTED BY: Lucas Mendonça
3 Replies
Posted 4 years ago

It is also possible to define a function of w (meaning omega) to produce the values needed. For example, below the transfer function magnitude in dB is calculated:

tf = 20/(20 + s)

(* 20/(20+s) *)

tfw = tf /. s -> I w

(* 20/(20+\[ImaginaryI] w) *)

LogLinearPlot[20 Log10[Abs[tfw]], {w, 1, 1000}, Frame -> True, 
 GridLines -> Automatic

enter image description here

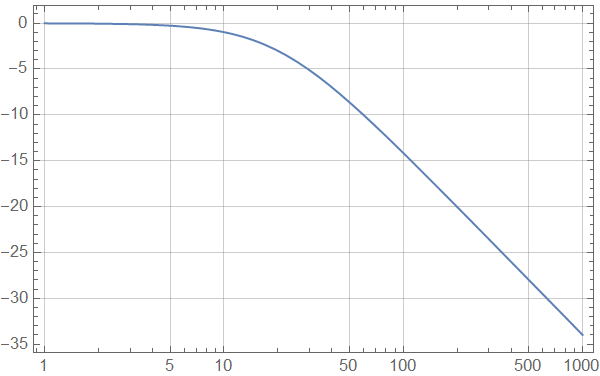
dBOut[w_] = 20 Log10[Abs[tfw]] // N;

outputTable = Table[{w, dBOut[w]}, {w, {1, 5, 10, 50, 100, 500}}]

(* {{1,-0.010843812922199395`},{5,-0.2632893872234916`},{10,-0.\
9691001300805643`},{50,-8.603380065709935`},{100,-14.149733479708177`}\
,{500,-27.965743332104292`}} *)
POSTED BY: David Keith

Hi Rohit Namjoshi

Thank you very much for your reply!

POSTED BY: Lucas Mendonça
Posted 4 years ago

Hi Lucas,

The x axis is logarithmic, so to get the actual values:

points = Cases[bpx, Line[pts_] -> pts, Infinity] // MapAt[(10^# &), #, {All, All, 1}] &;
points // 
  Map[ListLogLinearPlot[#, ImageSize -> Medium, Joined -> True, PlotRange -> All] &] //
  Row

enter image description here

POSTED BY: Rohit Namjoshi
Reply to this discussion
Community posts can be styled and formatted using the Markdown syntax.
Reply Preview
Attachments
Remove
or Discard

Group Abstract Group Abstract