4th note
Here is a new model applying Gompertz equation
Intending a differential equation model of COVID-19, for Italy, US, and Japan to estimate the trend including the future.
Where death number become y for the moment t, differential equation for y becomes, dy/dt= a y(N-y) where a is death coefficient, and N is the potential death number.
A solution becomes as, y(t)= N/(1+C Exp(-a N t)) where C is the integral constant. The result equation is so called Logistic equation.
We can obtain world COVID status from such a pages. In this case from GITHUB page
urlCovid19 = "https://pomber.github.io/covid19/timeseries.json"; data \
= Map[Association, Association[Import[urlCovid19]]["Italy"], {1}];
ddata = {DateObject[#["date"]], #["deaths"]} & /@ data;
firstday = ddata[[1, 1]];
Converting the data to the reported number separated.
i3 = Map[{QuantityMagnitude[#[[1]] - firstday], #[[2]]} &, ddata];
i4 = Map[First, Gather[i3, #1[[2]] == #2[[2]] &]]
Obtaining process of initial guess heuristically.
model = n/(1 + c Exp[-a n (t)]);
initialguess = {n -> 30000, c -> 5000, a -> 0.0000039};
Show[
 Plot[model /. initialguess, {t, 0, 1000},
  PlotRange -> {{0, 100}, {0, 50000}}],
 ListPlot[i4]
 ]
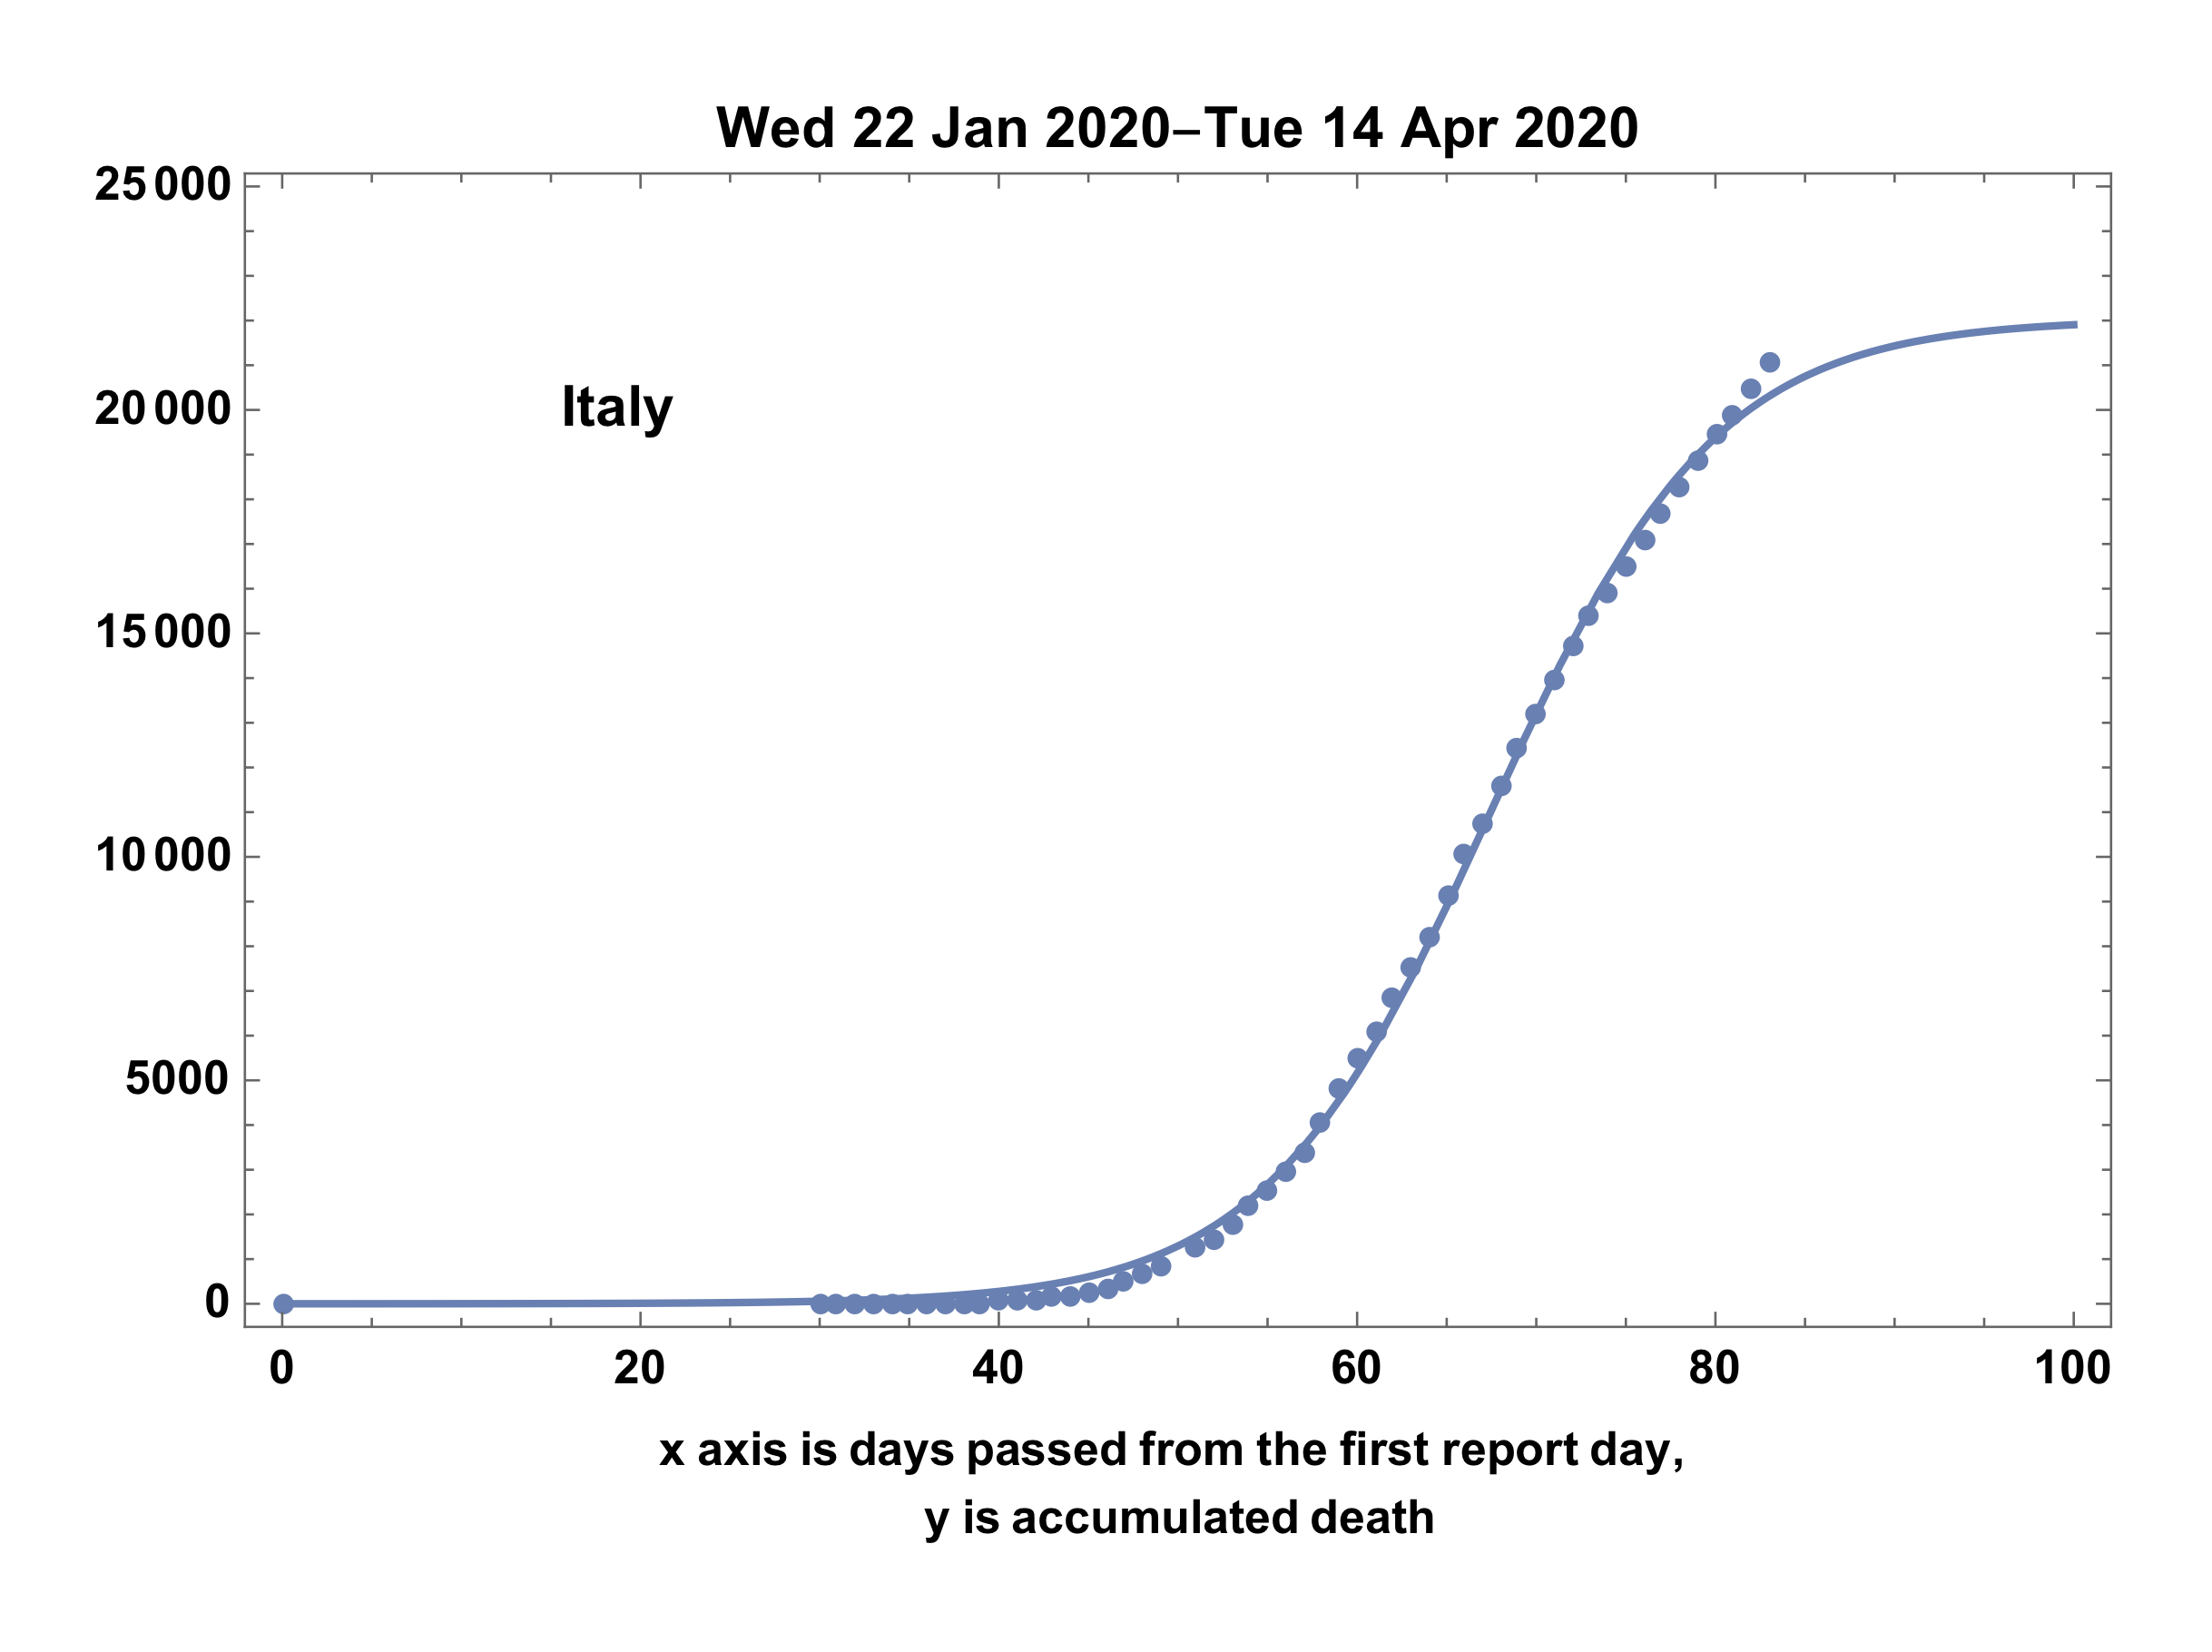
Fitting the death number to the model
ans = FindFit[i4, model, initialguess /. Rule -> List, t,
  MaxIterations -> 100]
Showing the result.
fdate = First[ddata][[1]];
ldate = Last[ddata][[1]];
upto = 100;

Show[
 ListPlot[i4,
  PlotLegends -> Placed[Text[Style["Italy", Bold]], {0.2, 0.8}]],
 Plot[model /. ans, {t, 0, upto}],
 PlotRange -> {{0, upto}, {0, 24000}},
 ImageMargins -> 20,
 Frame -> True,
 PlotLabel -> DateString[fdate] <> "-" <> DateString[ldate],
 FrameLabel ->
  "x axis is days passed from the first report day, \ny is \
accumulated death", LabelStyle -> {Black}]
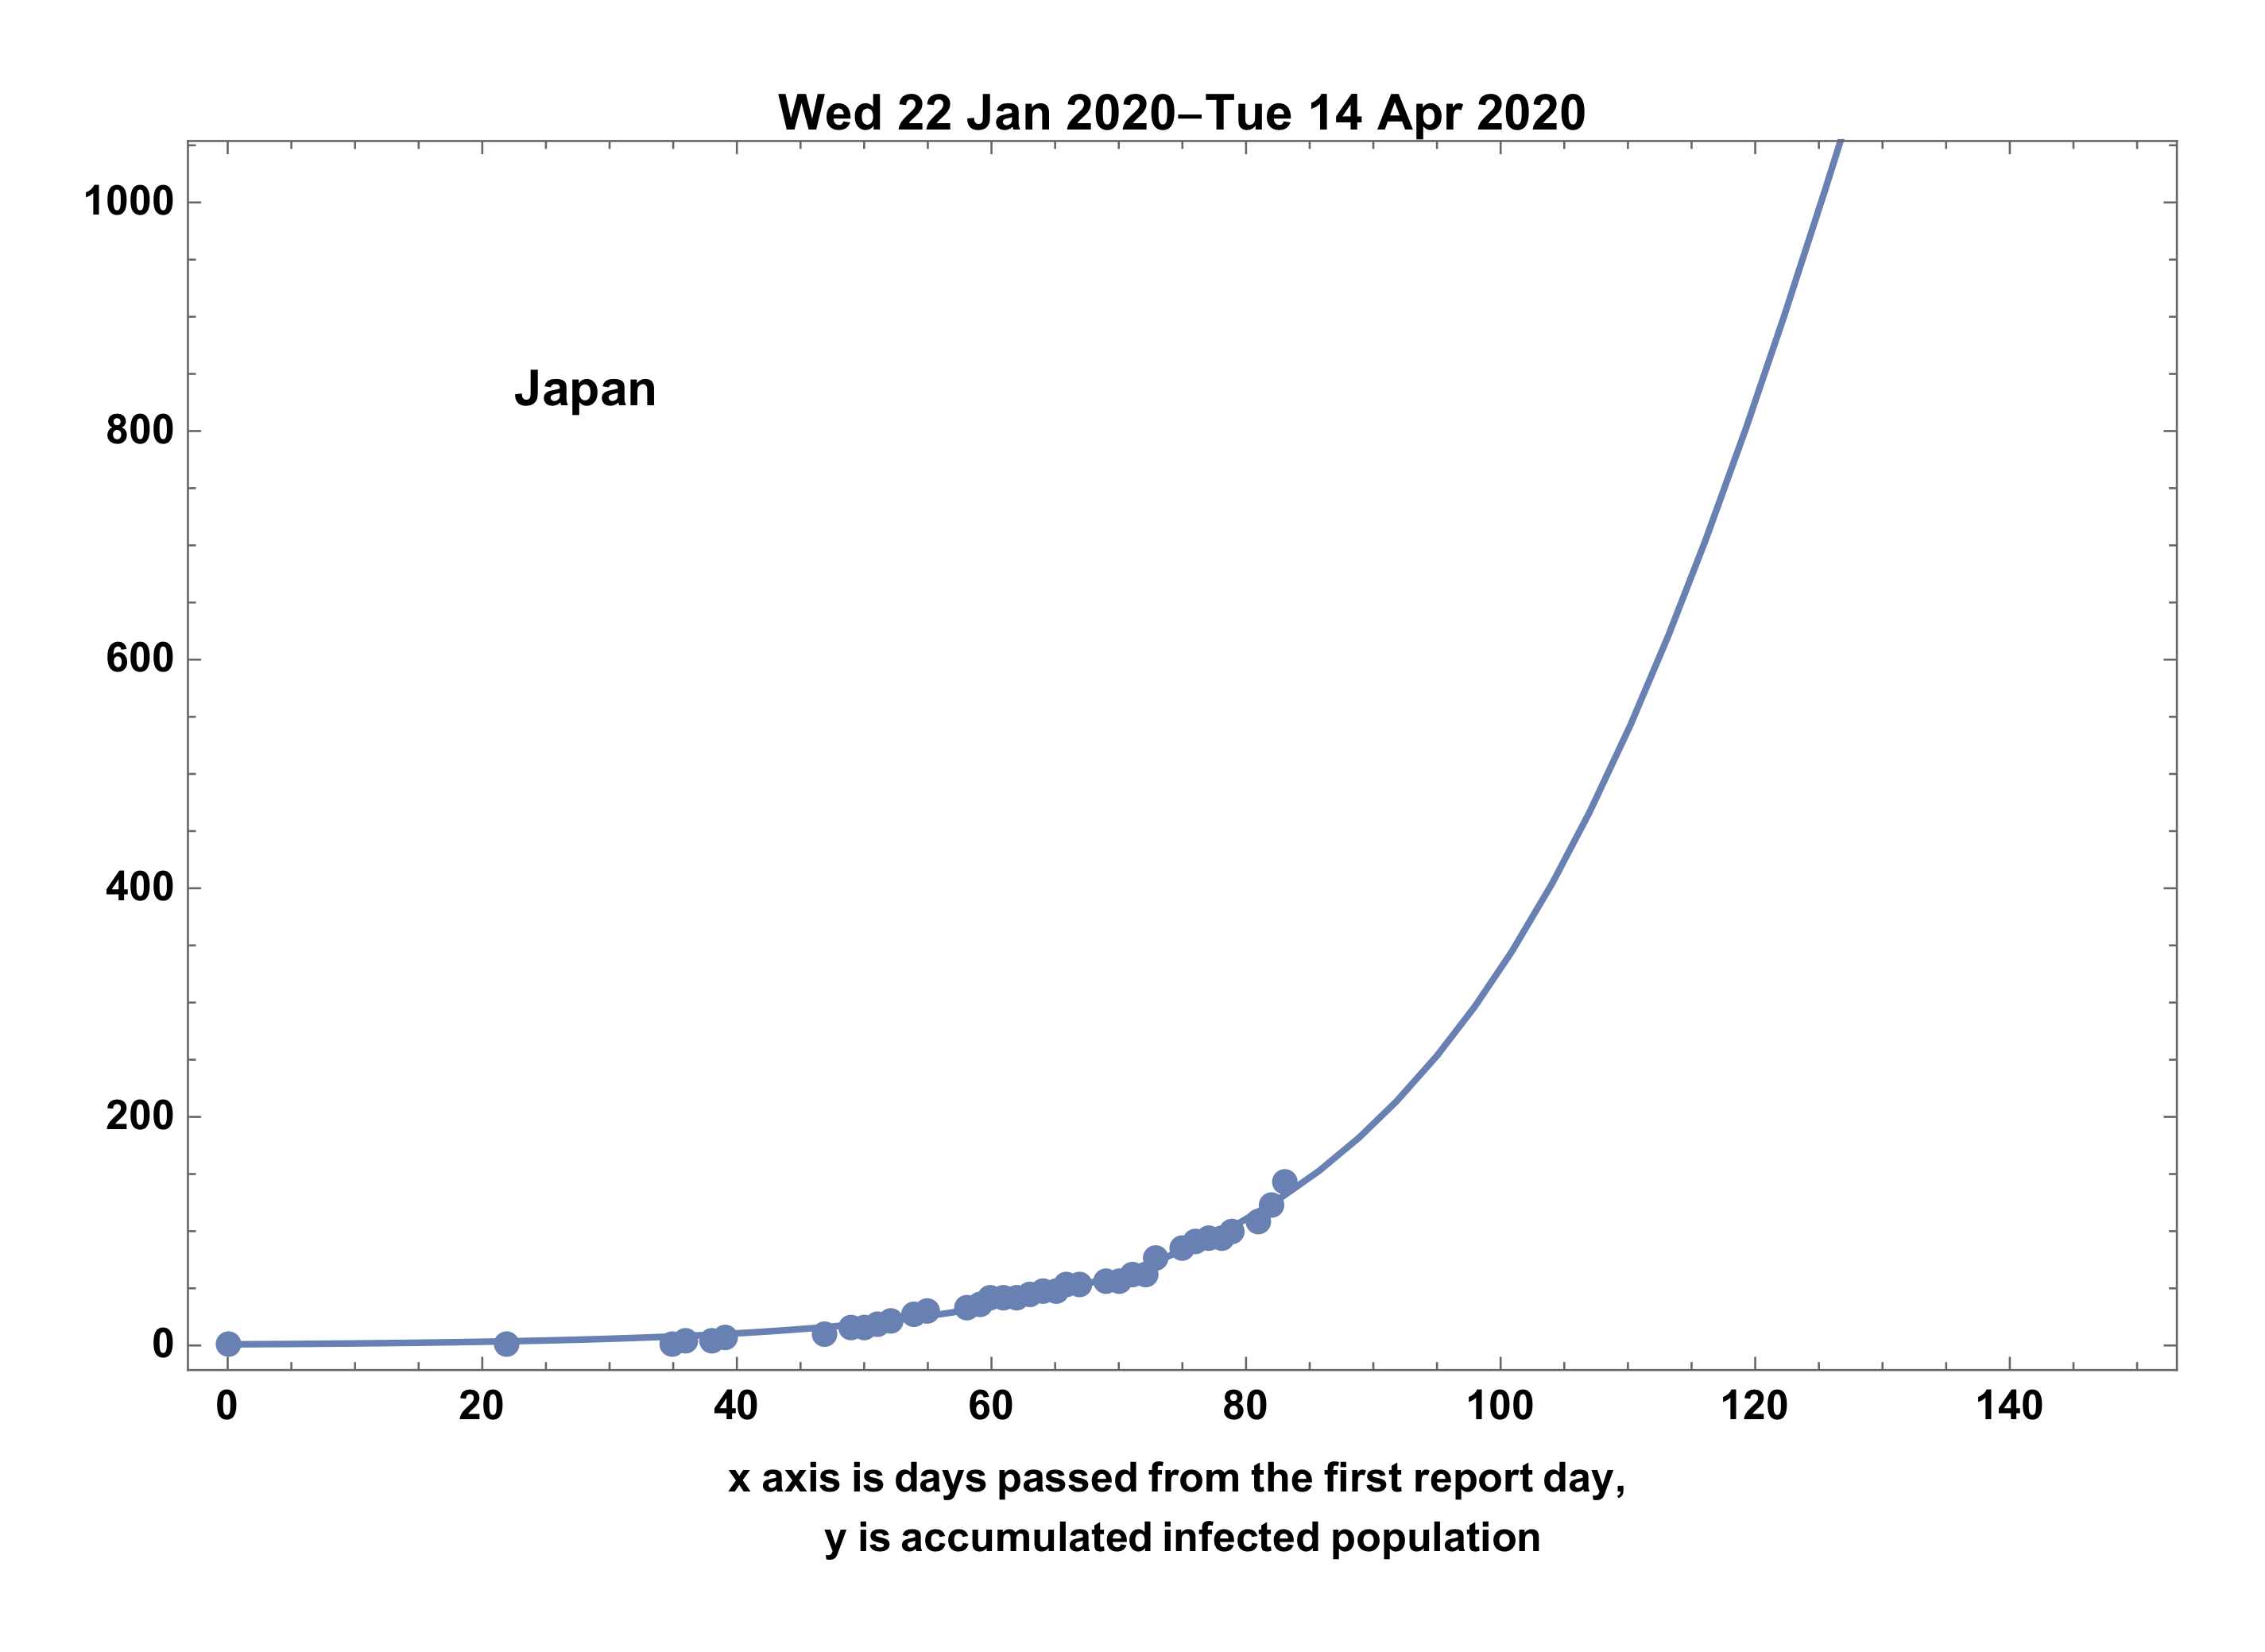
- Showing the result case of Japan
With the same process, we can fit the death number of Japan to the model. Strong suggestion derived from the graph is that each local curvature resulted by the natural human attitudes should be replaced to linear equation also resulted from the measures against the epidemic.
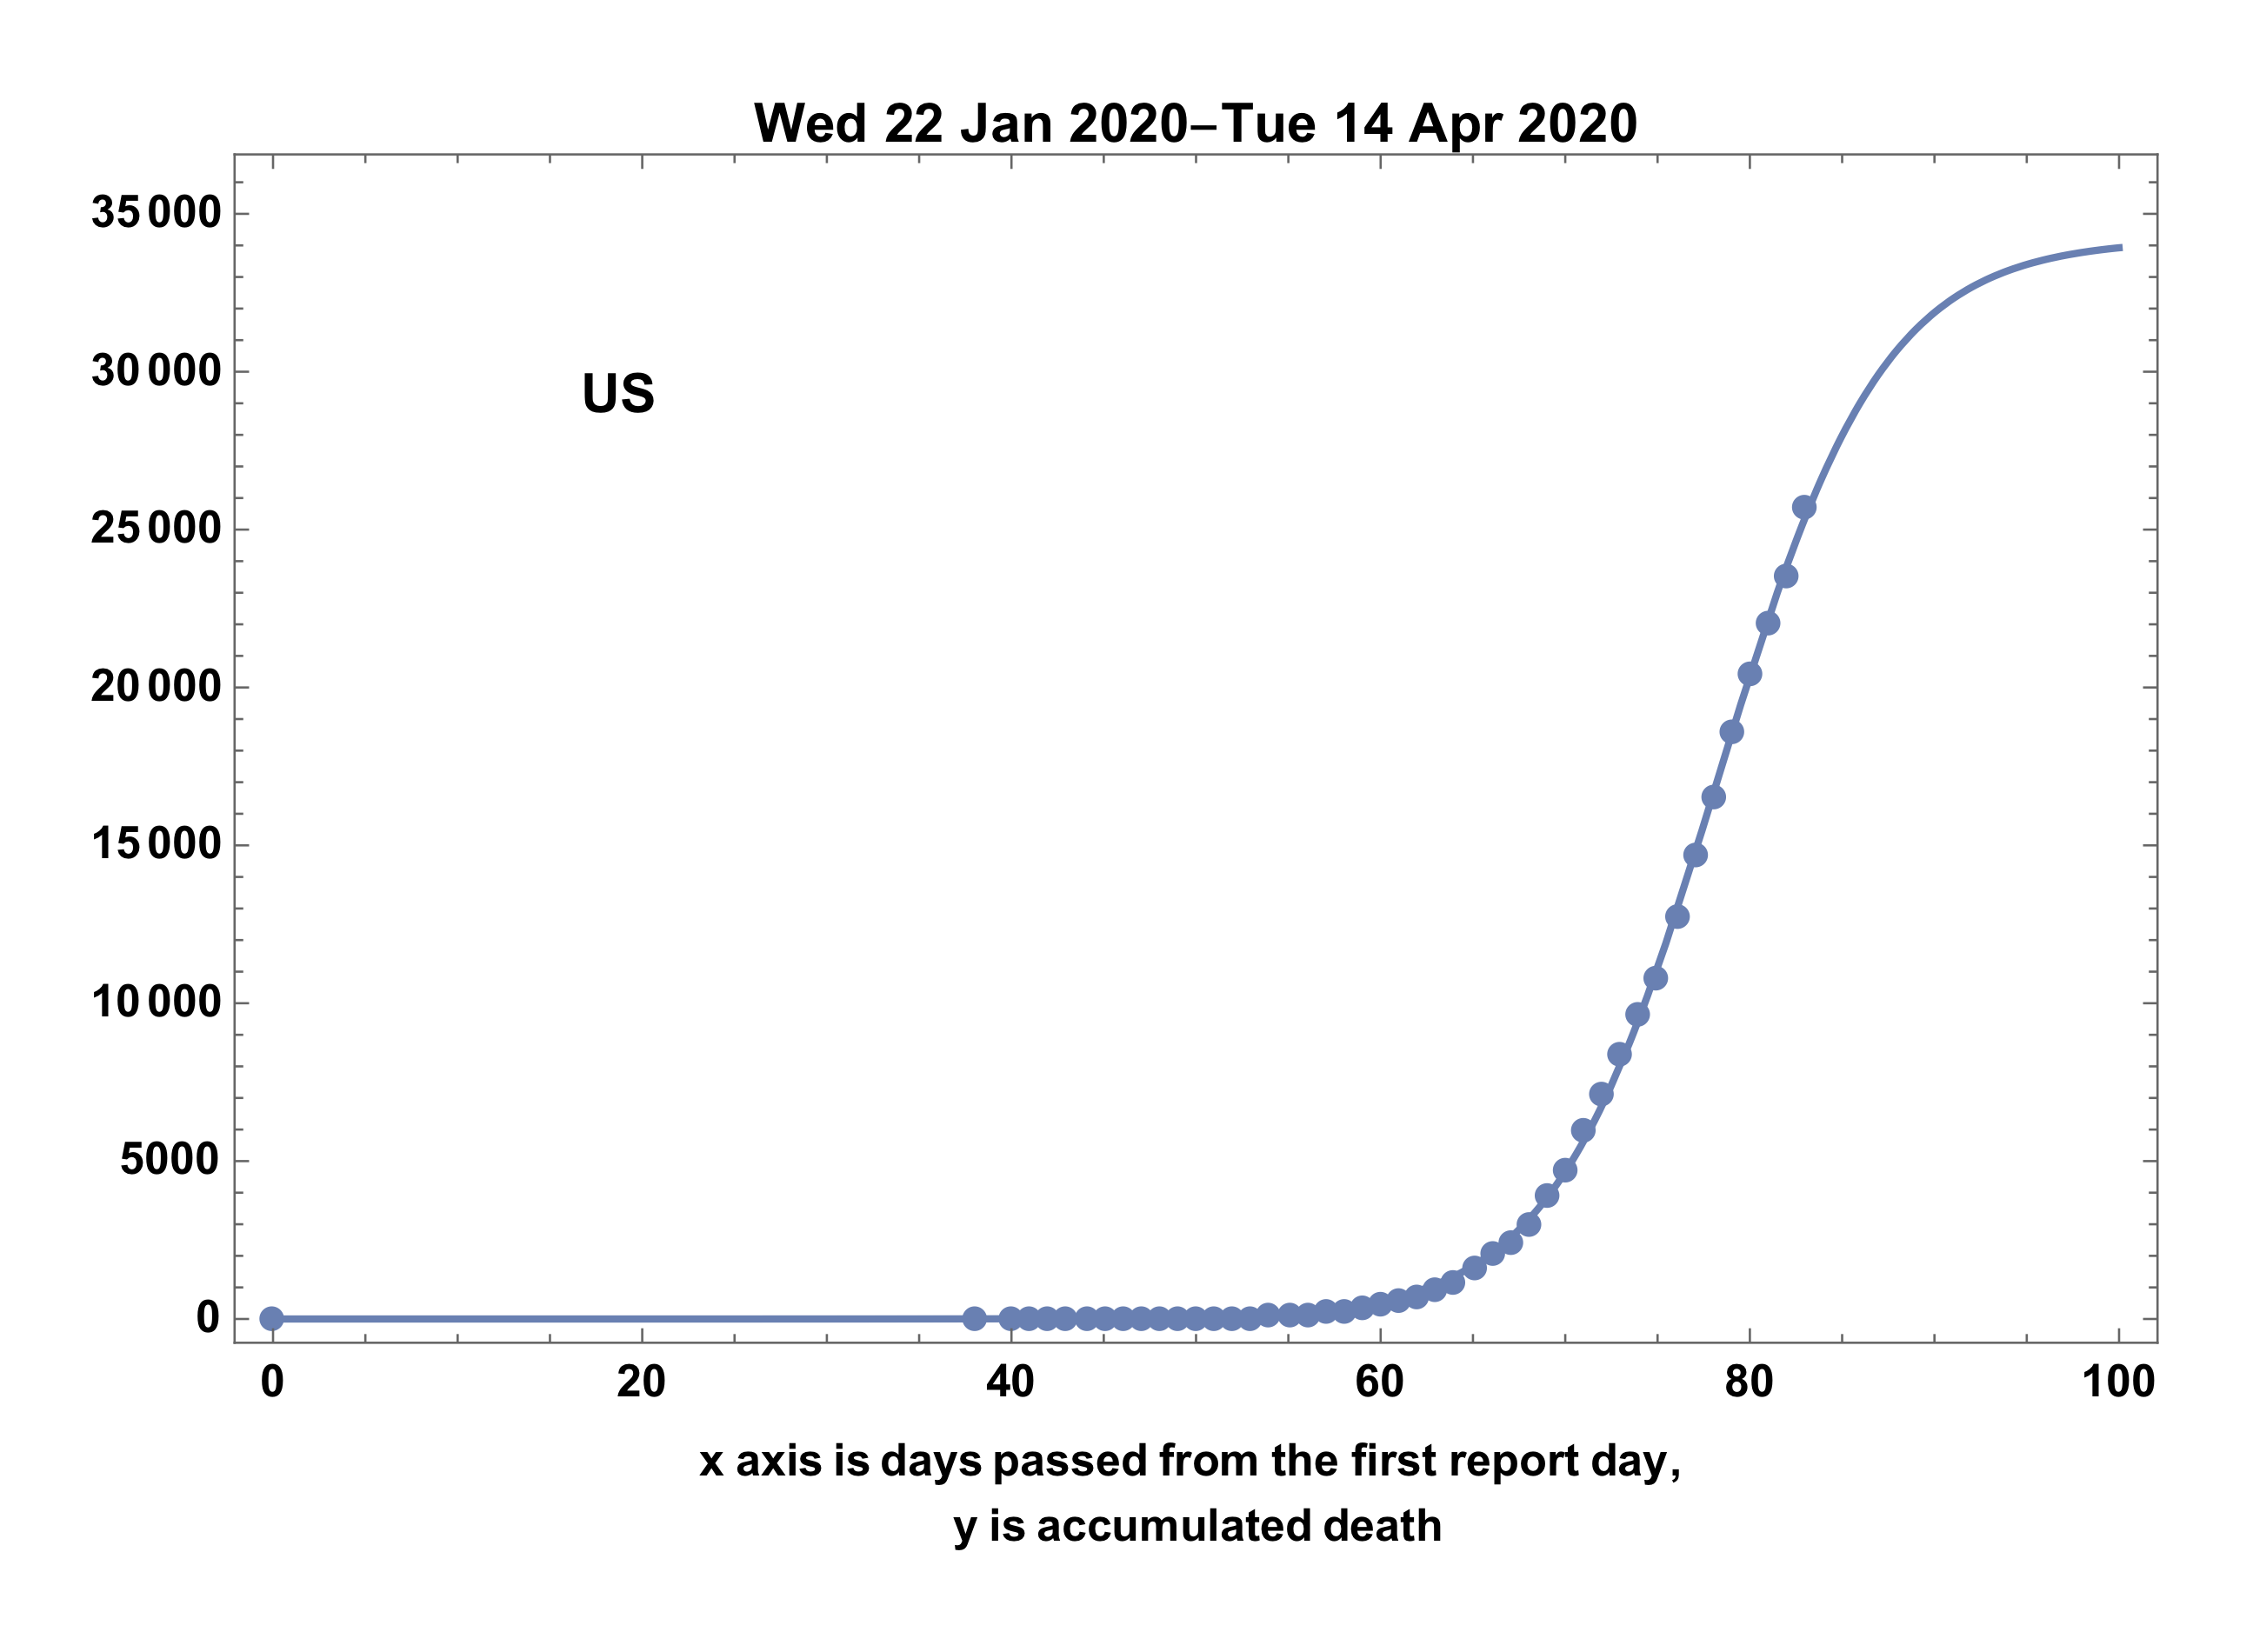
US case is as follows.
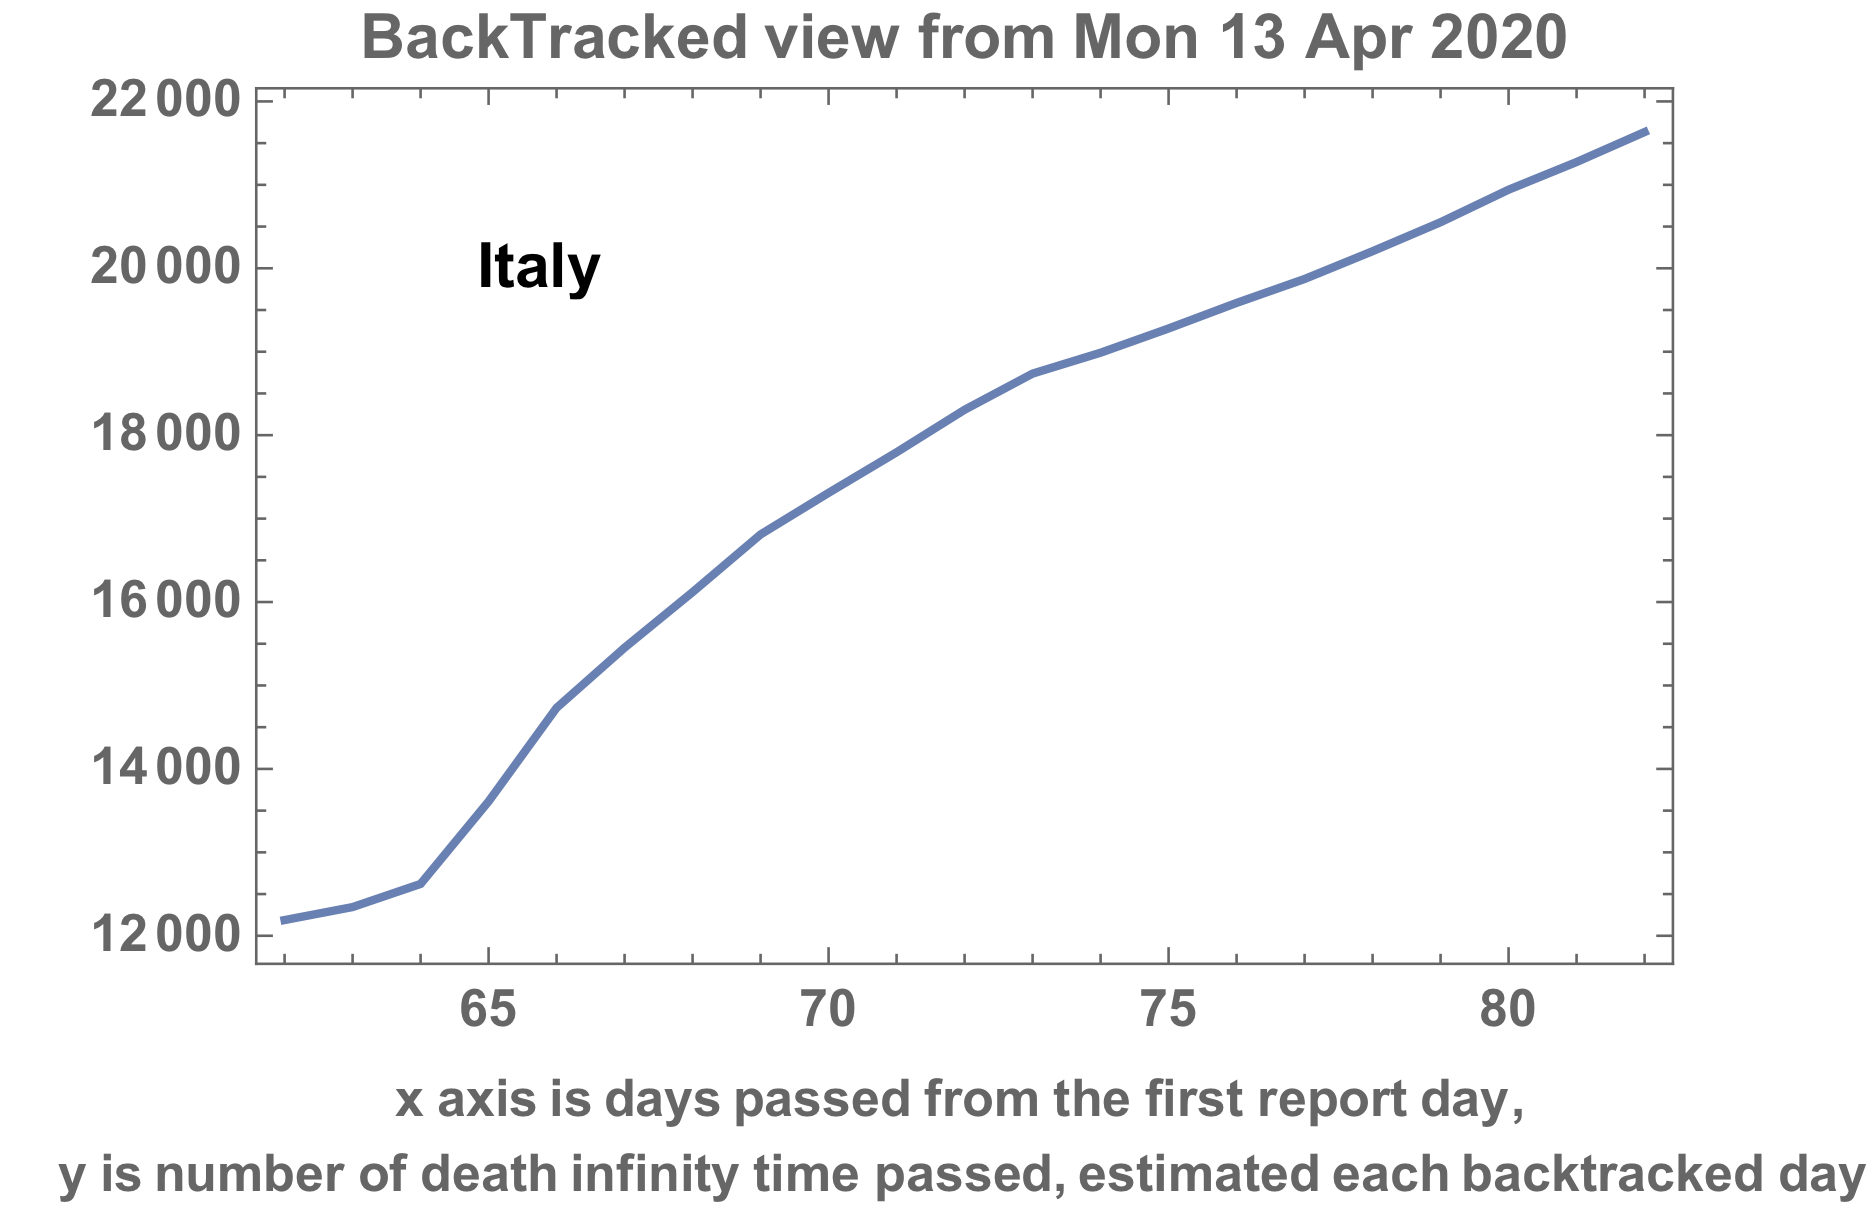
Backtracking evaluation for the case of Italy
using the last guess of fitting, can estimate death number of infinity (IDN) We can backtrack the IDN estimation, for each backtracked day. Followings are in the case of Italy.
backguess = ans;
Heuristically, obtained deepest backtrack number is (Apr.8, 2020),
backtrack = -21;
Backtracked estimated IDN list was,
estimatedIDN =
 Map[(ans =
     FindFit[Drop[i4, #], model, backguess /. Rule -> List, t,
      MaxIterations -> 500];
    model /. ans /. t -> Infinity) &,
  Reverse[Range[0, backtrack, -1]]]
Plotting past days estimated IDN trend.
lastDays = Take[i4, backtrack - 1] /. {x_, _} -> x;
lastdayspair = Transpose[{lastDays, estimatedIDN}];
ListLinePlot[lastdayspair]