MODERATOR NOTE: coronavirus resources & updates: https://wolfr.am/coronavirus

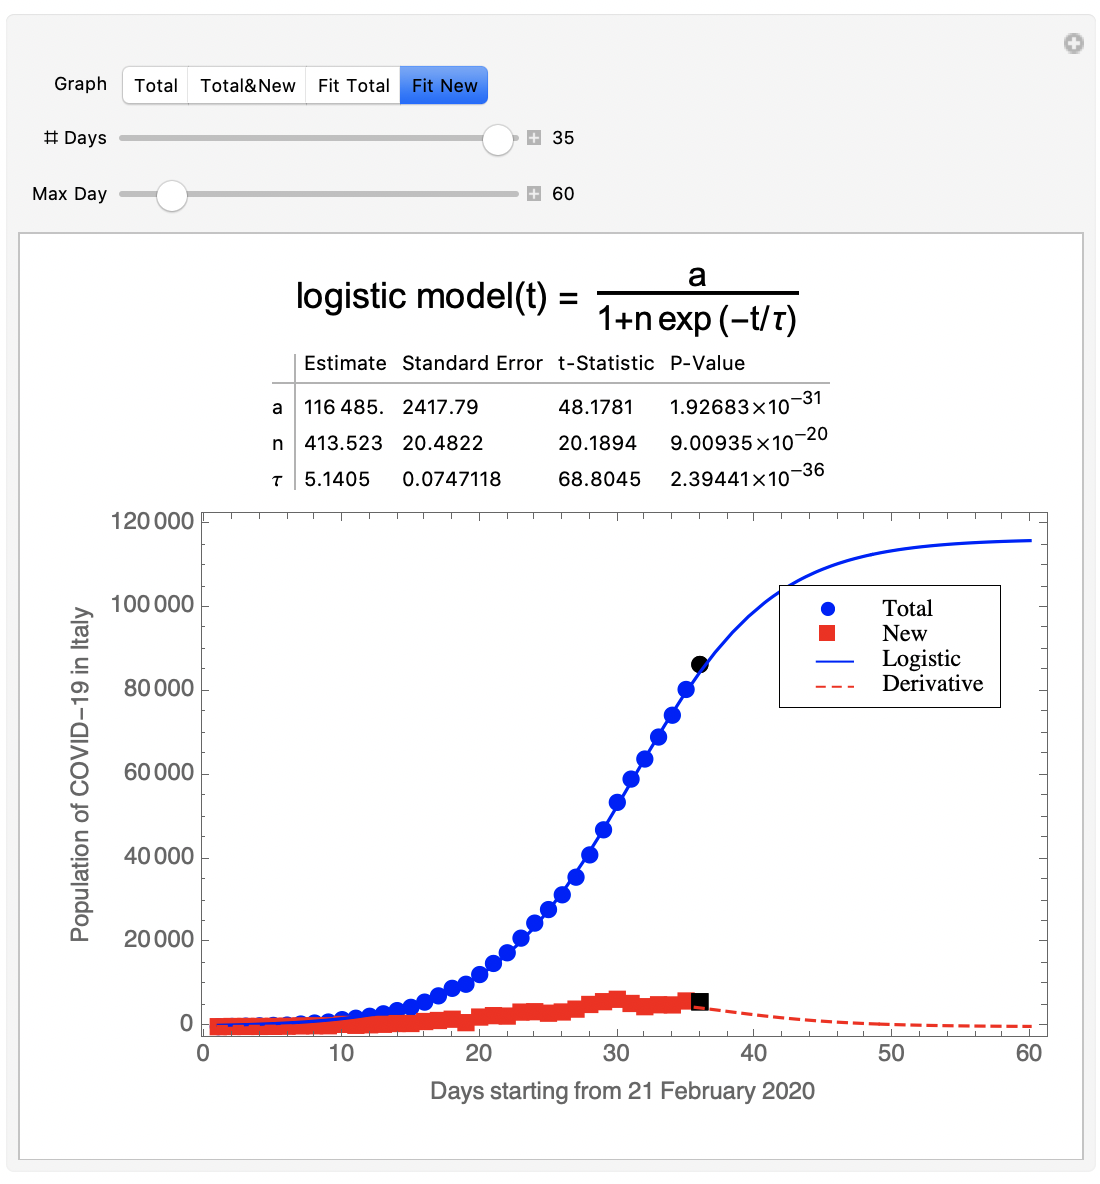
Pandemia of COVID-19 data for Italy. We present the data plot of the total and new daily infections by COVID-19 virus in Italy day by day starting from the beginning of contagion on 21 February 2020. We then present the non linear least square fit of the total infections data with a logistic curve (from the Verhulst model) and the fit of the new daily infections data with the derivative of the logistic curve. One can interactively choose the different graph, the number of days in the data points used for the fit, and the maximum day in the graph. The demonstration automatically reads the new data published by the italian "Protezione Civile" day by day. The data are taken from the following Wikipedia site:
2020 coronavirus pandemic in italy
verhulst growth model
In order to open and run the attached CDF demonstration file it is necessary to download and install the Wolfram CDF Player at this link.
 Attachments: