Message Boards Message Boards

0
|
10649 Views
|
2 Replies
|
3 Total Likes
View groups...
Share
Share this post:

Plot a Gaussian beam wavefronts as a function of distance from beam waist

Hi all,

I'm currently trying to visualise the beam profile of a laser in 2D and include the wavefronts every z=10 (so z={10, 20,30...etc}, given that the limits of the plot in the z-dirn will be +- 100.

The beam radius follows a simple equation as a function of distance (z) from the waist (w0 where z=0)

I have plotted the beam profile according to it's radius:

beamprofile[zlimit_] := 
 Module[{w, beamwaist,w0, \[Lambda]},
  w0 = 100*10^-3; (* set beam waist radius to 100\[Mu]m *);
  \[Lambda] = 0.7*10^-3; (*set wavelength of laser to 700nm *)


  w[z_] := w0*Sqrt[1 + ((\[Lambda] z)/(\[Pi] w0^2))^2]; 

  beamwaist = Plot[{-w[z], w[z]}, {z, -zlimit, zlimit},
    PlotRange -> All,
    PlotStyle -> {Blue, Blue},
    PlotLabel -> Style["Gaussian Beam profile"]]

  ]

Adding the wavefronts becomes difficult as they are transverse (ie. along the vertical axis) and they are not circular. I'm trying to bound these wavefronts by the upper and lower beam radii curves.

As mentioned above the wavefronts are gaussian.

I have tried multiple ways to parametrize, or create circles to use with varying radii of curvature to no avail. The radii of curvature of the wavelengths follow this equation:

R[z_]: = z*(1+((\[Pi] w0^2)/(\[Lambda] z))^2

The closest I have gotten was to include Bezier curves between the points needed, but these aren't bounded by the upper and lower beam profile:

beamprofile[zlimit_] := 
 Module[{w, R, d, curves, beamwaist, wavefronts, \[Theta], 
   w0, \[Lambda]},
  w0 = 100*10^-3; (* set beam waist radius to 100\[Mu]m *);
  \[Lambda] = 0.7*10^-3; (*set wavelength of laser to 700nm *)


  w[z_] := w0*Sqrt[1 + ((\[Lambda] z)/(\[Pi] w0^2))^2]; 


  R[z_] := z*(1 + ((\[Pi] w0^2)/(\[Lambda] z))^2);


  beamwaist = Plot[{-w[z], w[z]}, {z, -zlimit, zlimit},
    PlotRange -> All,
    PlotStyle -> {Blue, Blue},
    PlotLabel -> Style["Gaussian Beam profile"]];

  \[Theta][x_] := ArcSin[w[x]/R[x]];

  d[x_] := R[x] (1 - (w[x]/R[x])^2)^(1/2);

  curves = 
   Graphics[
    Table[BezierCurve[{{R[z] - d[z], w[z]}, {z, 
        0}, {R[z] - d[z], -w[z]}}], {z, zlimit/10, 2*zlimit, 
      zlimit/5}]];

  Show[{beamwaist, curves}]

  ]
beamprofile[100]

Any assistance or advice is welcome!
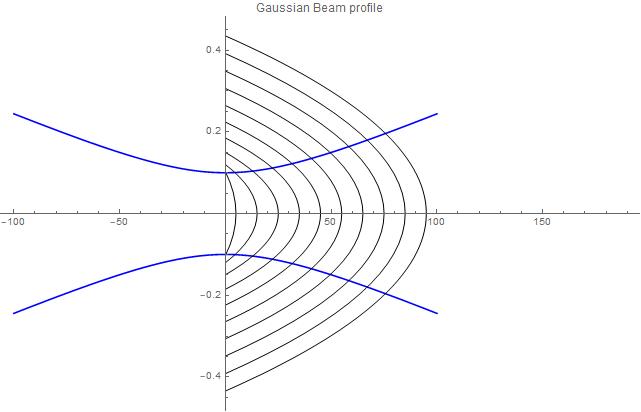
Progress so far

POSTED BY: Jon Rickett
2 Replies

Great thanks!

POSTED BY: Jon Rickett

The intersection of the circular wavefronts and the beam waist can be solved for:

Clear[w0];
Clear[\[Lambda]];
sols = Solve[{(z - (zp - R[zp]))^2 + w^2 == R[zp]^2, (w/w0)^2 == 
     1 + ((\[Lambda] z)/(\[Pi] w0^2))^2}, {z, w}];
sols = {z, w} /. sols;
Last[sols]

After which the wavefronts can be plotted:

zlim = 20;
w0 = 1;
\[Lambda] = 1.0;
w[z_] := w0*Sqrt[1 + ((\[Lambda] z)/(\[Pi] w0^2))^2];
R[z_] := z*(1 + ((\[Pi] w0^2)/(\[Lambda] z))^2);
zs[zp_] := (-2 \[Pi]^4 w0^6 + Sqrt[
   4 \[Pi]^8 w0^12 - 
    4 (-2 \[Pi]^4 w0^6 zp + \[Pi]^2 w0^4 zp \[Lambda]^2 - \[Pi]^2 \
w0^2 zp^3 \[Lambda]^2) (\[Pi]^2 w0^2 zp \[Lambda]^2 + 
       zp \[Lambda]^4)])/(
  2 (\[Pi]^2 w0^2 zp \[Lambda]^2 + zp \[Lambda]^4));
ws[zp_] := Sqrt[
  3 \[Pi]^2 w0^4 zp + zp^3 \[Lambda]^2 + (
   2 \[Pi]^6 w0^10)/(\[Pi]^2 w0^2 zp \[Lambda]^2 + 
    zp \[Lambda]^4) - (\[Pi]^2 w0^4 Sqrt[
    4 \[Pi]^8 w0^12 - 
     4 (-2 \[Pi]^4 w0^6 zp + \[Pi]^2 w0^4 zp \[Lambda]^2 - \[Pi]^2 \
w0^2 zp^3 \[Lambda]^2) (\[Pi]^2 w0^2 zp \[Lambda]^2 + 
        zp \[Lambda]^4)])/(\[Pi]^2 w0^2 zp \[Lambda]^2 + 
    zp \[Lambda]^4)]/Sqrt[\[Pi]^2 w0^2 zp + zp \[Lambda]^2];
\[Beta][zp_] := ArcSin[ws[zp]/(R[zp])];
zPoints = Select[Range[-zlim, zlim, zlim/10.], # != 0 &];
\[Beta]Bounds = \[Beta] /@ zPoints;
waveFronts = 
  MapThread[
   Circle[{#1 - R[#1], 0}, 
     Abs[R[#1]], ({-#2, #2} + 
       If[R[#1] < 0, \[Pi], 0])] &, {zPoints, \[Beta]Bounds}];
(*points=Point[{#,0}]&/@zPoints;*)
waistPlot = Plot[{w[z], -w[z]},
  {z, -zlim, zlim},
  PlotLabel -> Style["Gaussian Beam profile"],
  Epilog -> {Blue, waveFronts},
  AspectRatio -> Automatic,
  PlotStyle -> Blue]

Gaussian Beam profile

Reply to this discussion
Community posts can be styled and formatted using the Markdown syntax.
Reply Preview
Attachments
Remove
or Discard

Group Abstract Group Abstract