Here is a short presentation I prepared:
Code 1635
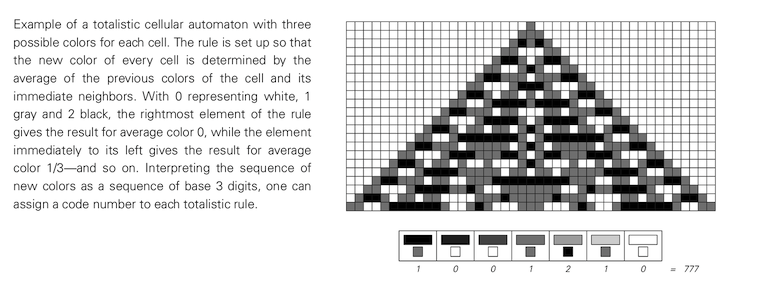
1-D totalistic cellular automaton with three colors

Find the long-term behavior of code 1635.
What happens if one extends the picture above? Does the center region eventually become repetitive? Or does it take over the whole pattern? How sensitive are the results to the details of the initial conditions used?
Totalistic CA
Description from A New Kind of Science, by Stephen Wolfram.
Question
What happens if one extends the picture above? Does the center region eventually become repetitive? Or does it take over the whole pattern? How sensitive are the results to the details of the initial conditions used?
I explored this question with programs I wrote in Python. I used the numpy, zlib, pandas, and matplotlib.pyplot libraries.
Approaches to the problem
- Delineate the borders of the central region. The borders are easy to see by eye and it seems like they should be easy to find programmatically. However, this is easier said than done. It could possibly be done by sliding a 'window' over a particular row from left to right, looking at the values in that window. You might have to increase the width of the window as you go down. You have to be a certain distance out to see the border.
- Look at the complexity of the successive rows.
Complexity
The central region is complex. The two border regions are repetitive, and, hence, not complex. The two middle regions, each between the center region and one of the border regions is simple.
Complexity of successive generations
- In the previous picture, the complexity remains constant through successive generations. (At least it does once you go far enough down that the borders are stable.)
- If the center region eventually becomes repetitive, then the complexity over successive generations should level off. If the center region takes over the whole pattern, then the complexity over successive generations should grow without bound.
Measure complexity of generations
I measure the complexity of a row by how much zlib.compress will compress it.

As you can see the complexity indeed does decrease over the generations observed.
Sensitivity to initial conditions
Previously we started with a single 1 in the center cell. The screenshot below is from Examples of 1D Three-Color Totalistic Cellular Automata, a Wolfram Demonstrations Project.
This is code 1635 with initial conditions of [1, 1, 1].

It is markedly different than using the initial condition of [1]. We would probably need to run it for many more generation to see whether the central region becomes complex.
Initial conditions of [1, 1, 1]

Conclusions
- All of this is experimental. It doesn't prove anything.
- However, it indicates that the central region may eventually be repetitive.
- Need to look at more initial conditions.
** Does anyone have any suggestions on things to look at?**
Source code
References
Any suggestions or comments are welcome.


