MODERATOR NOTE: coronavirus resources & updates: https://wolfr.am/coronavirus
It's inspiring to see so many people in the community devoting time and expertise to tracking and understanding this pandemic. Here at Wolfram, we've been trying to keep on top of a few critical datasets related to COVID-19 (see the "Curated Computable Data" section in the main hub post linked above) and present them through the Wolfram Data Repository so they're ready for immediate analysis in the Wolfram Language. But there are obviously tons of other data resources available, either directly relating to the pandemic or providing helpful historical, medical, or other context. We've had a lot of different suggestions inside the company for further additions to WDR or Wolfram|Alpha, but we can't possibly tackle everything — so we'd like to invite people in the community to contribute to making more data surrounding this topic computable.
First: there are a few suggestions below, but we'd welcome others; I'd hope that part of this hub could just be a growing list of links to useful and relevant external data sources. Even if you don't have the time or ability to scrape and transform a particular dataset yourself, someone else might be able to tackle it. A few initial ideas:
Second: if you have the time and inclination to scrape data from one of these sources and try to put it in a more computable form, please jump in and do so! We've already seen what people can do with the "curated computable data" we're providing, and having more neatly-packaged data resources available to the community would benefit everyone.
If you're not completely confident in your Wolfram Language data curation skills, we do have a lot of resources to help you improve, like a helpful screencast series at
https://github.com/WolframResearch/Data-Curation-Training.
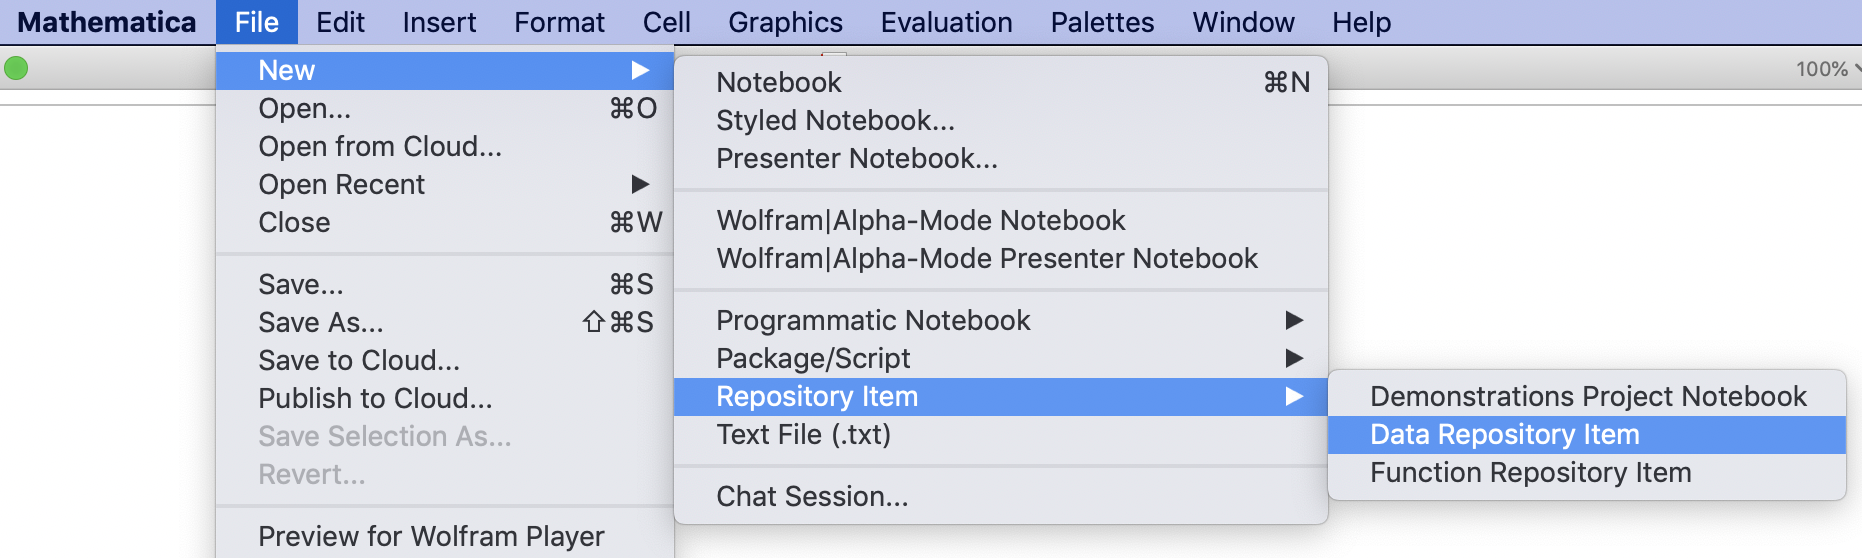
And if you've got a dataset or collection of data around this topic that you'd like to make available to the community — I strongly recommend preparing it using the Data Resource Definition Notebook (available from the File menu in Mathematica, as below):
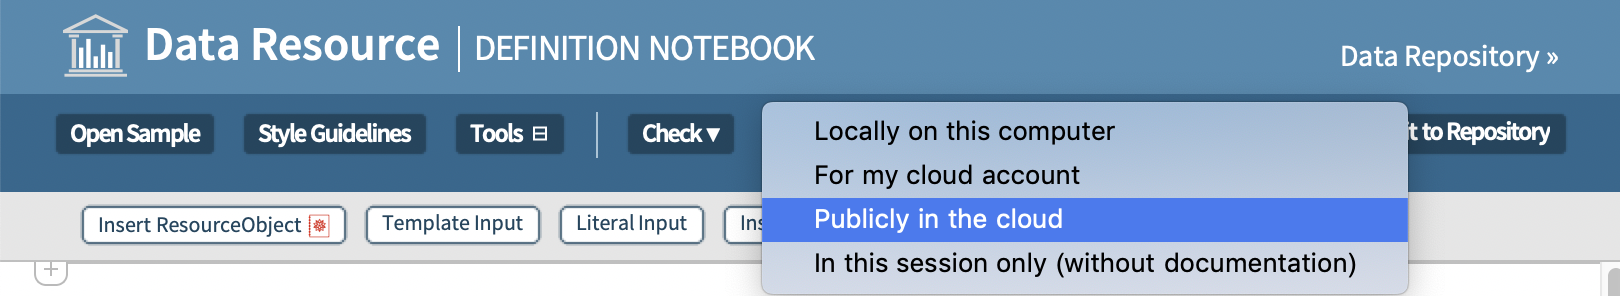
Particularly for work being done around the topic of COVID-19, where time is of the essence and many data resources are changing rapidly, I'd also strongly encourage you to deploy finished resources directly to the cloud, instead of submitting to the Wolfram Data Repository for formal review and publication:
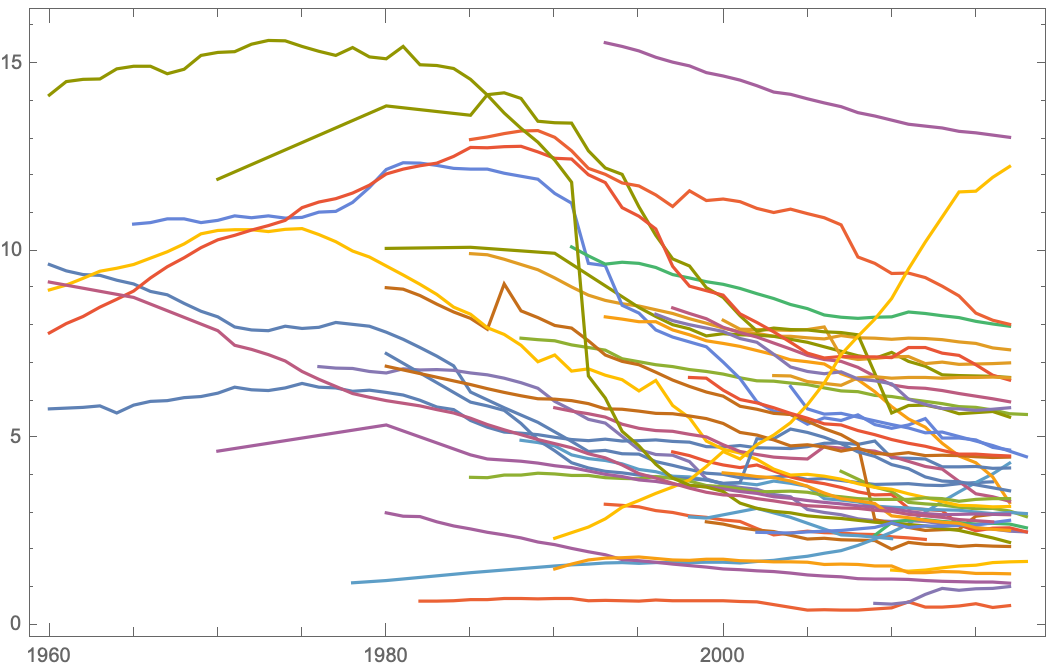
Deploying resources in this way will make them easily and immediately accessible to other users, and also automatically create a "shingle" for your data resource where anyone can view your data and analysis, while Wolfram Language users can directly access the underlying data as easily as any object published in the WDR:
DateListPlot[
 ResourceData[
   "https://www.wolframcloud.com/obj/alanj/DeployedResources/Data/Hospital-Beds-by-Country"][All, #TotalBedsPer1000Inhabitants &]]
In the interest of making data available to people as quickly as possible, this is probably the best route to follow right now — but I would definitely hope to see lots of user creations become formal Wolfram Data Repository submissions eventually, after "peer review" and revision by the community.


