MODERATOR NOTE: coronavirus resources & updates: https://wolfr.am/coronavirus
While we at Wolfram have been providing updated computable genetic and protein resources corresponding to the resources provided by the National Center for Biotechnology Information (NCBI), these aren't the only sources of great genetic information. There are even more comprehensive sources in databases shared in worldwide collaboration between medical researchers. Although this genetic information cannot be distributed to the general public for a variety of reasons, fortunately one great source does share derived analysis. This post will show you some initial ways to analyze the Nextstrain COVID-19 data through Wolfram technology, and we hope you can develop these further to satisfy your own curiosity.
The primary data resources provided by Nextstrain are its Newick trees. Newick is a format for expressing phylogenetic trees in terms of nested branches with distances. Here is a trivial example shown with an imported result and dendrogram using the ImportNewickString and NewickDendrogram WFR functions: 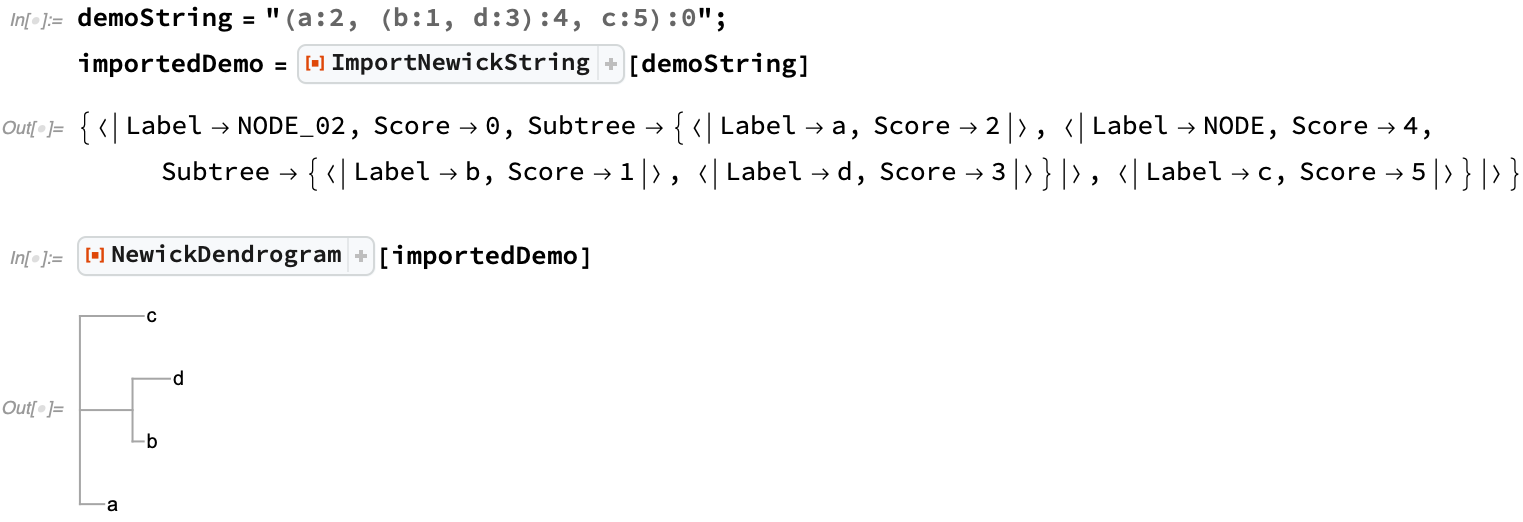
We observe that the nodes b and c are at the same depth, given that they are the same overall distance from the root (4+1 and 5 respectively).
The first Newick tree provided by Nextstrain is a genetics-driven clustering that does not take the collection date into account. This Nextstrain COVID-19 data is provided from a link at the bottom of the Nextstrain global page: 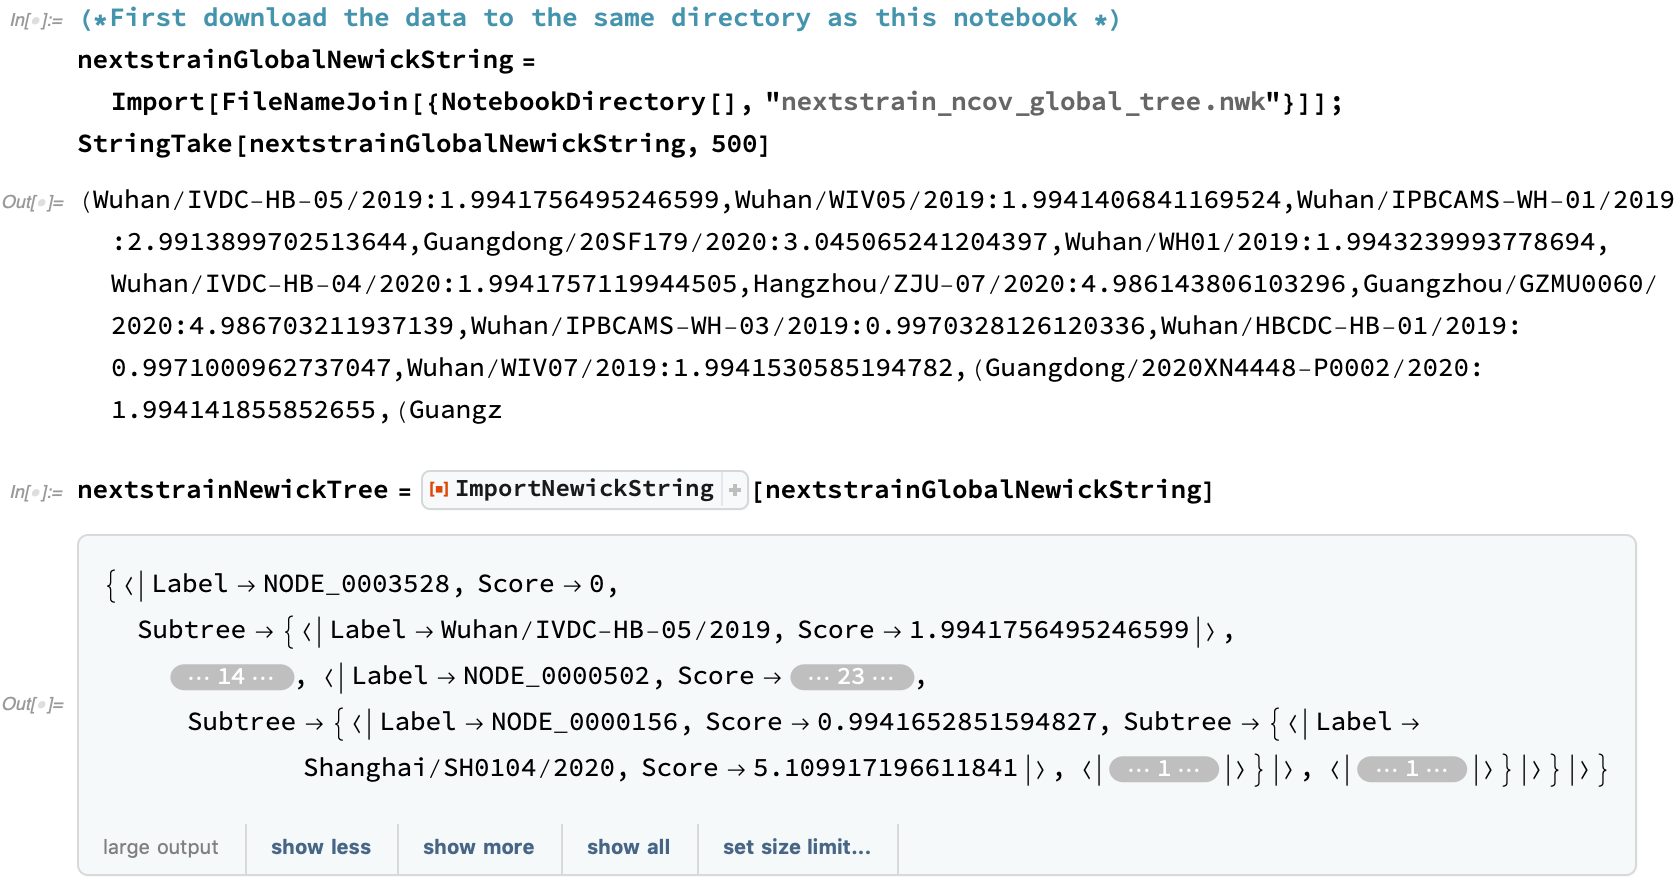
This tree, having the recorded COVID-19 history, could rather large. Let's see how big a graph that generates if we include all of the intermediate nodes: 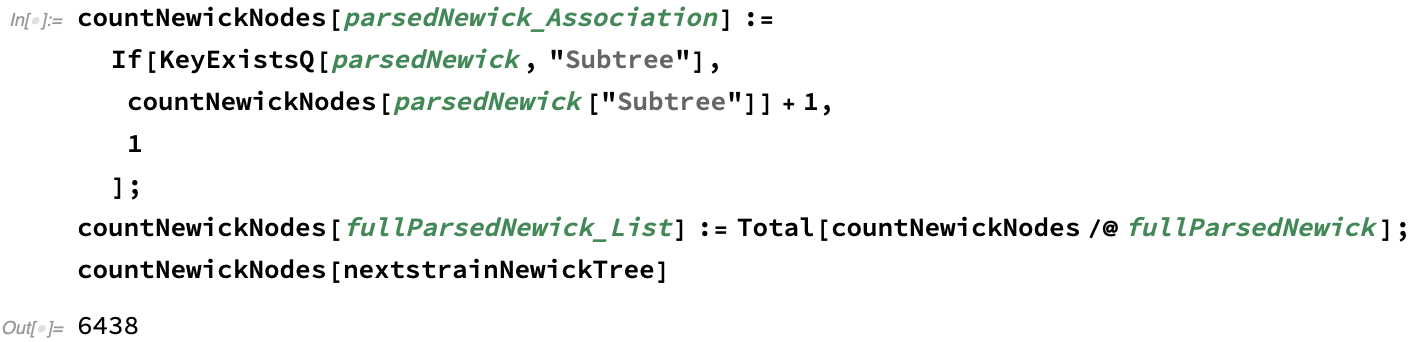
While the NewickDendrogram function can plot such a tree legibly, it is very large with corresponding navigational difficulties. Though it's impractical to be shown here, feel free to try it on your own machine:

Instead, what we can do is show the tree up to a given level of nesting, truncated recursively from the root: 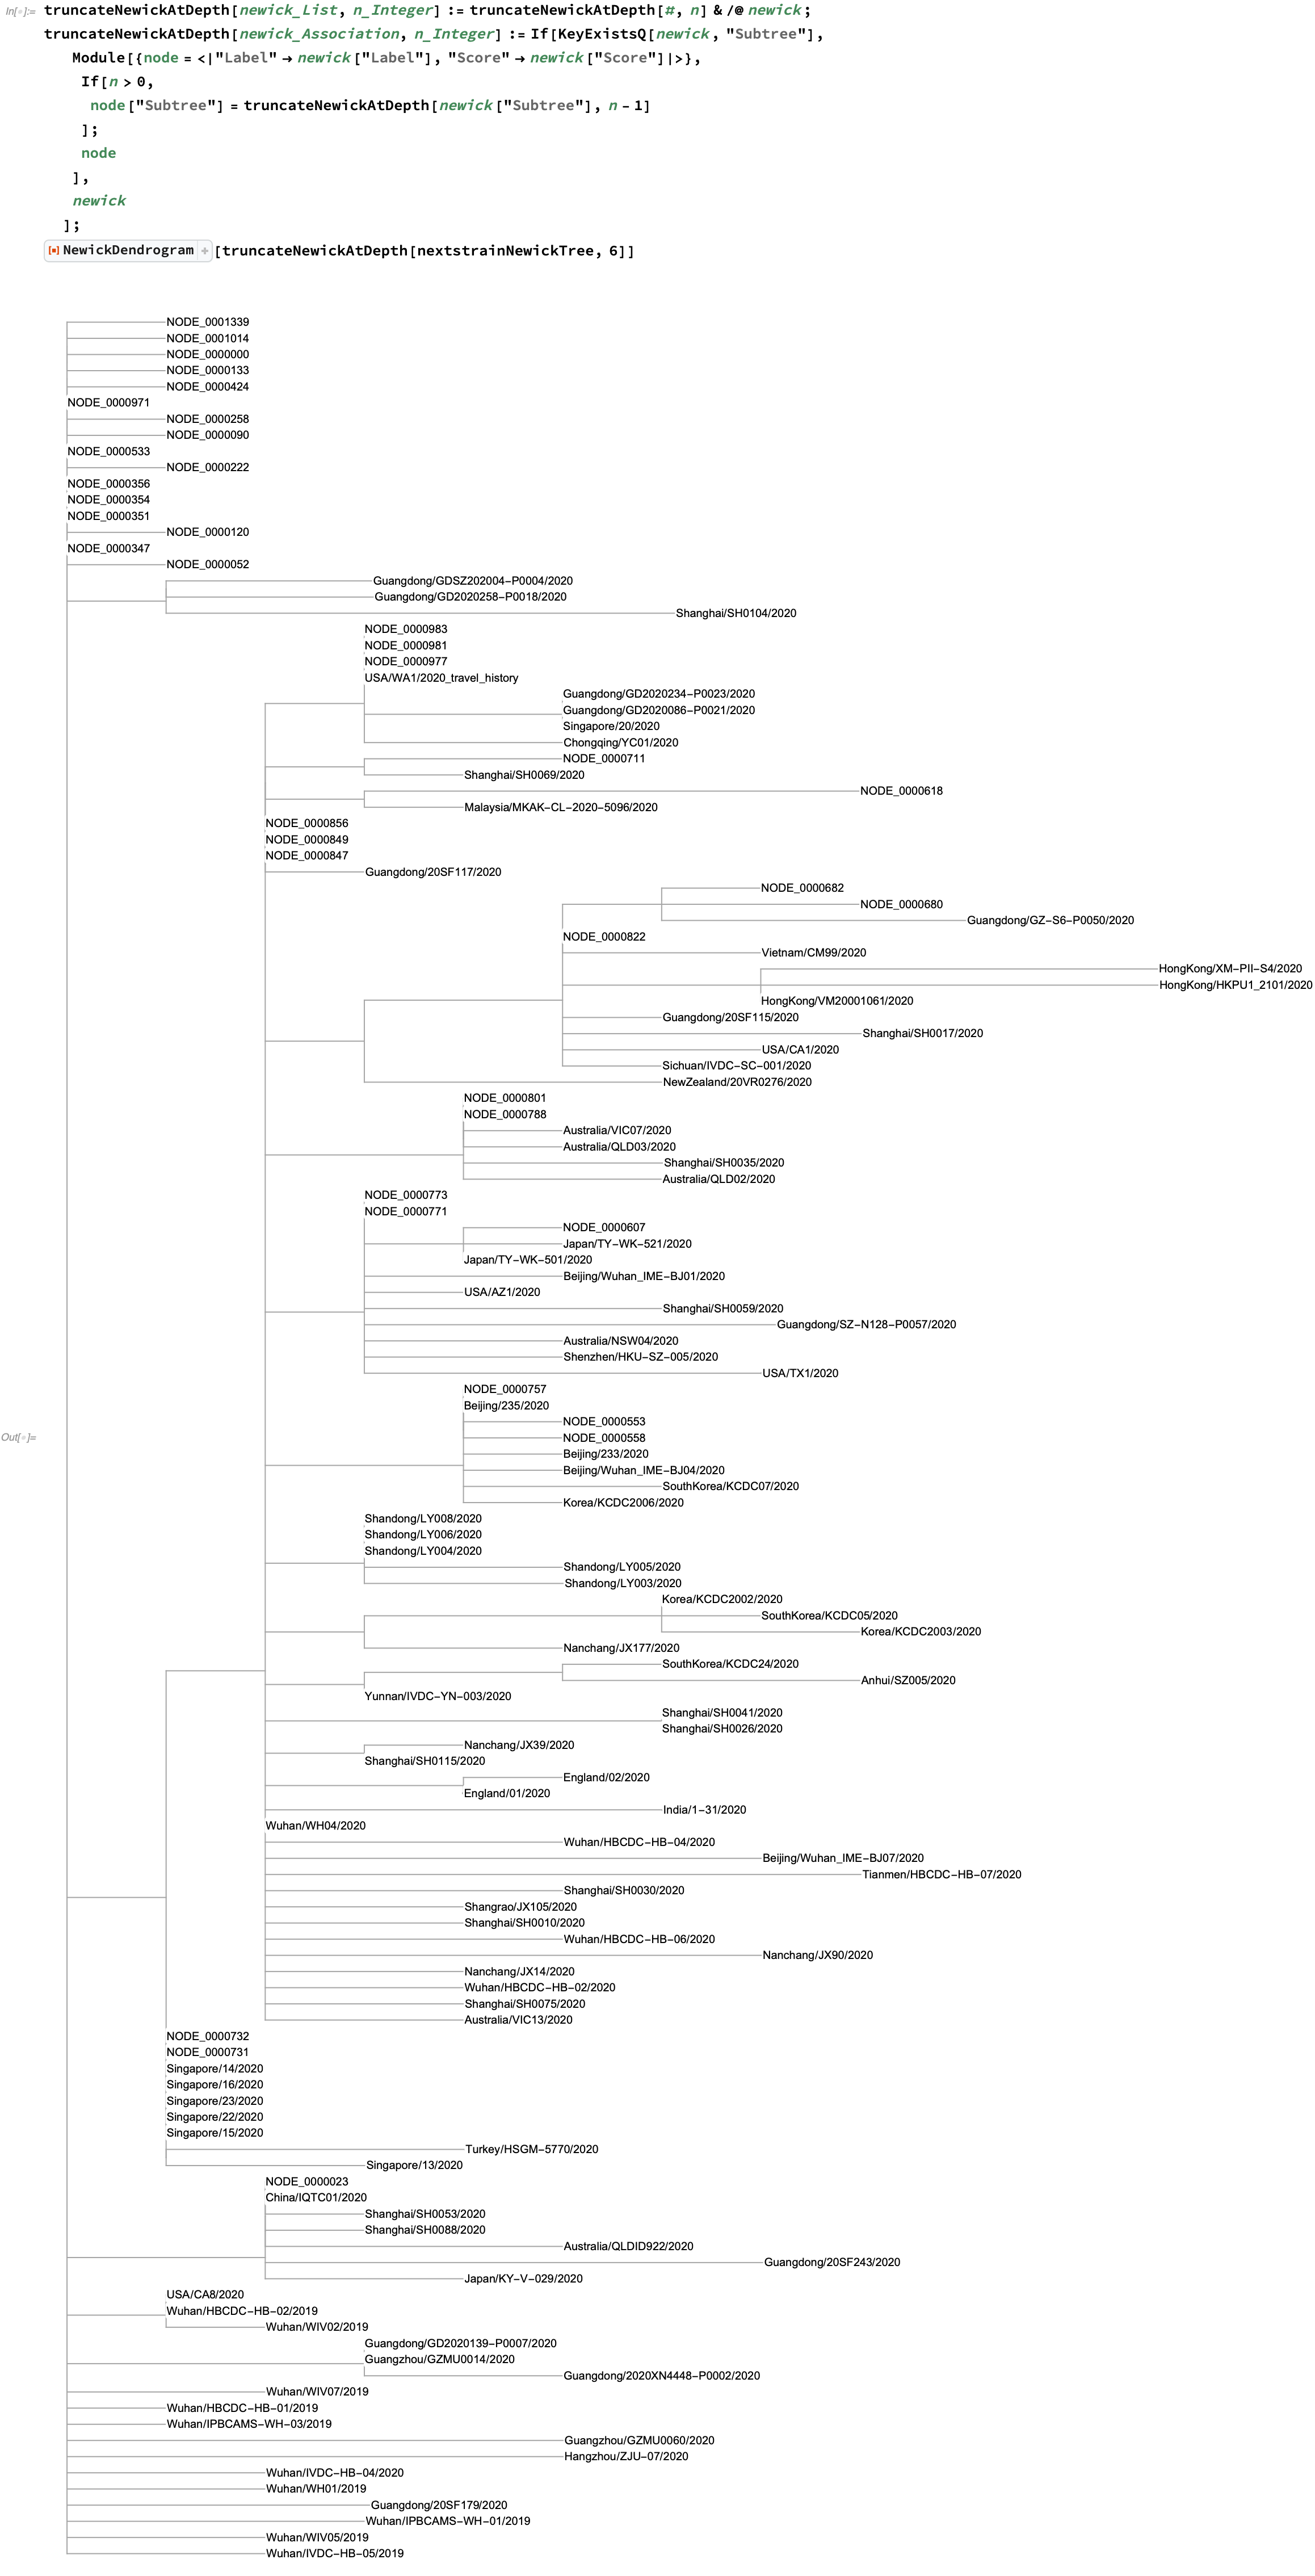
In this tree, all of the non-strain nodes are of the form NODE_<number>. If we'd like to look further into the tree, we can find such a node and similarly display a truncated subset of it: 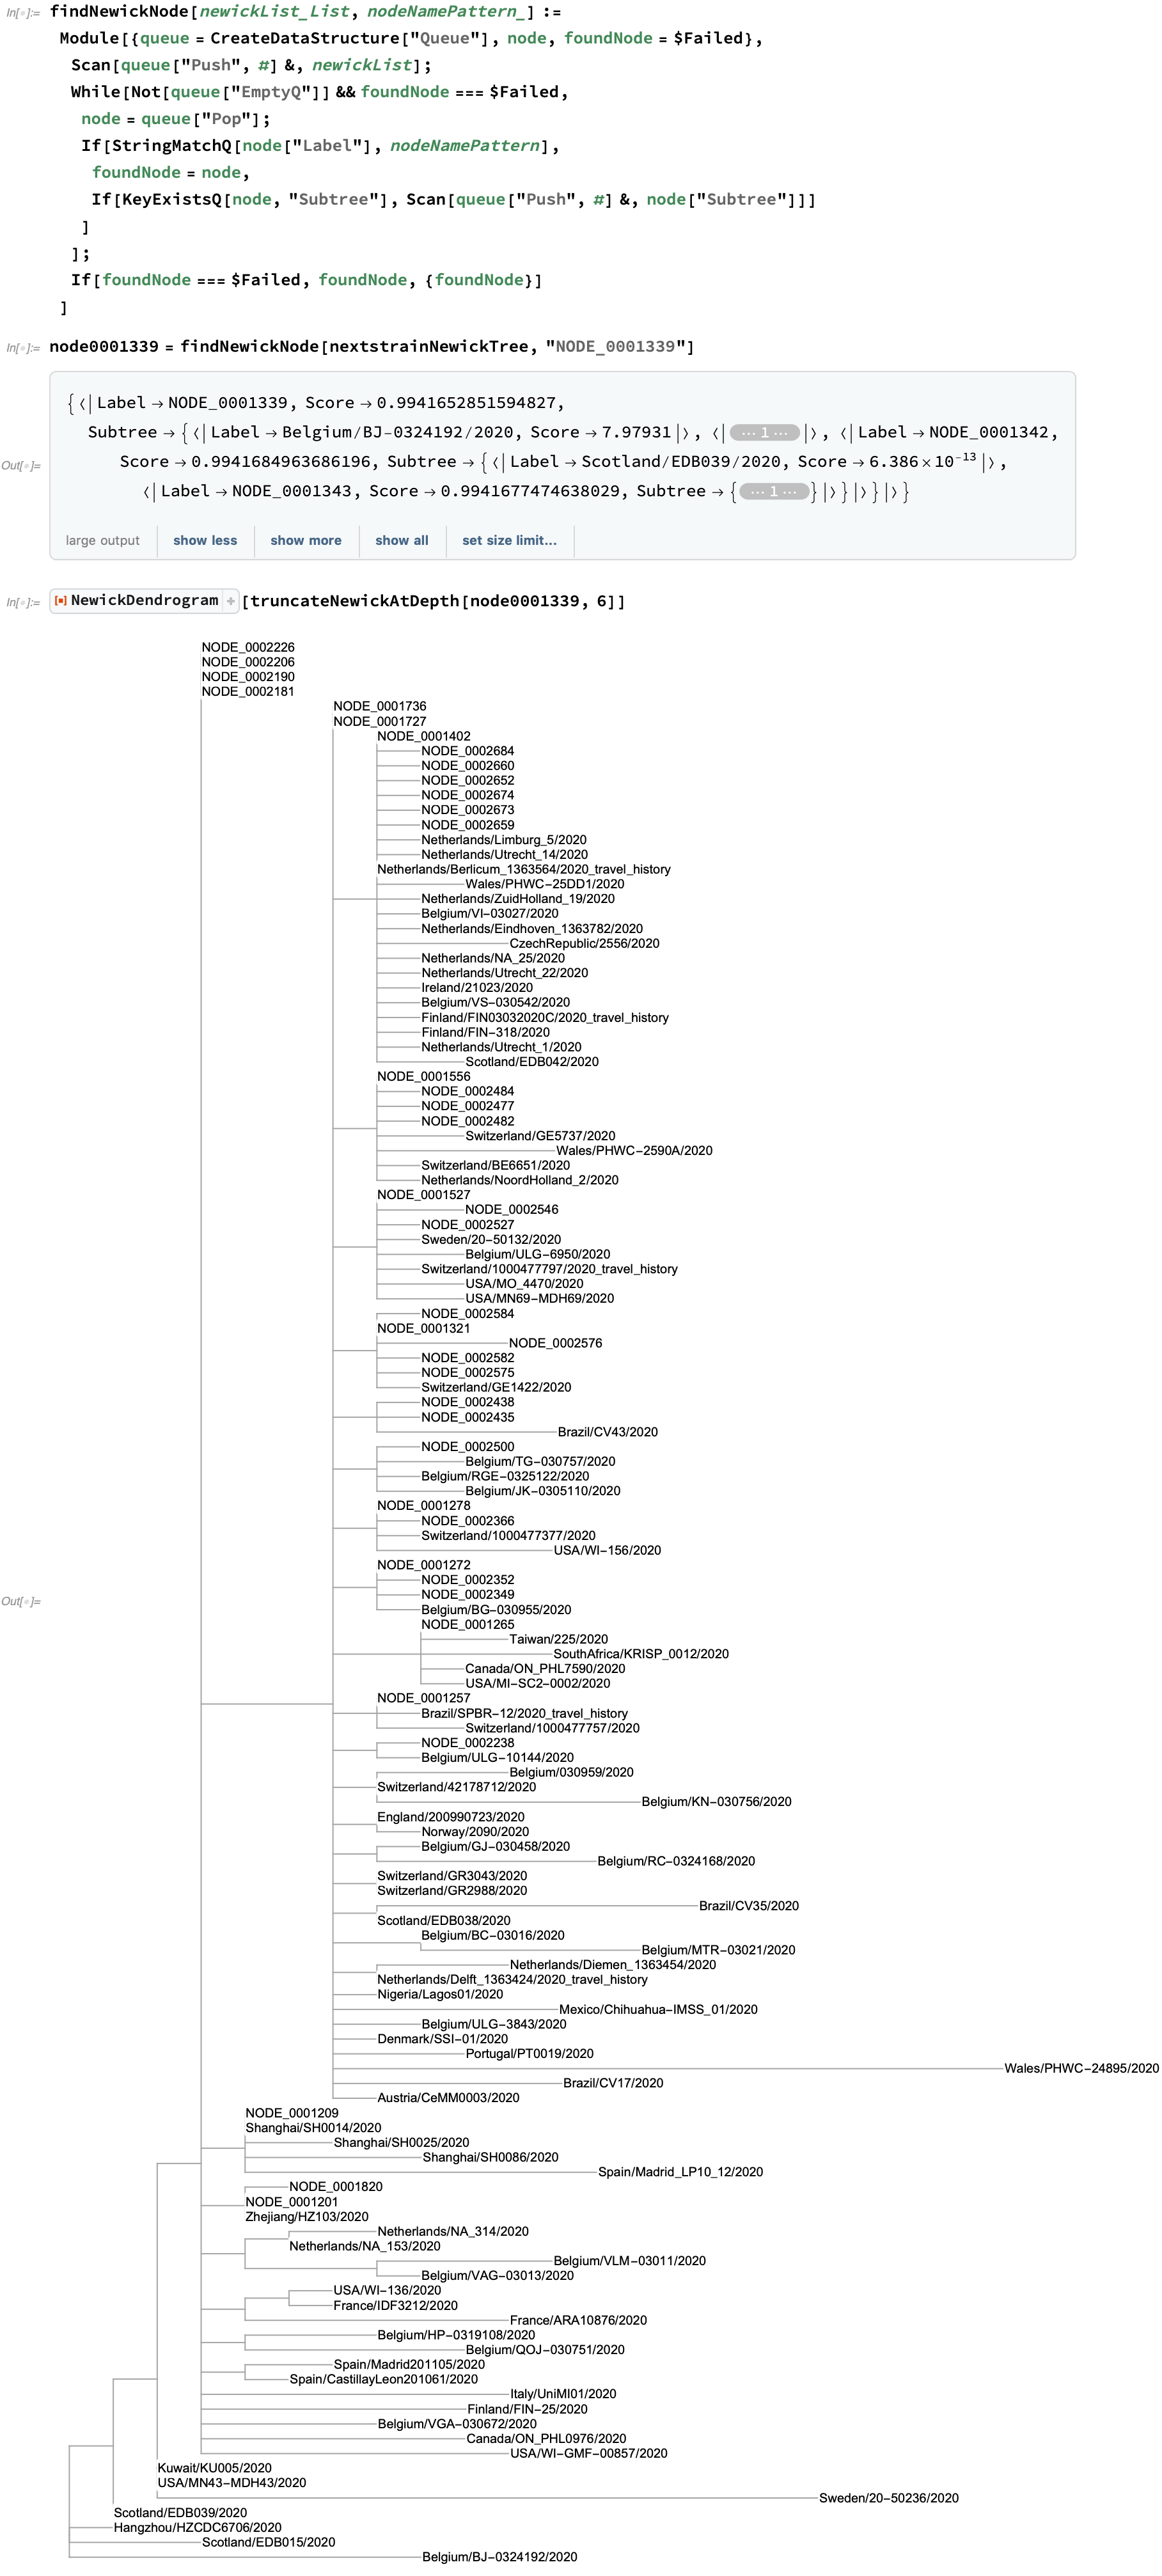
Nextstrain also provides Newick trees which incorporate collection timing into their distance assessments to better track the history of strain development: 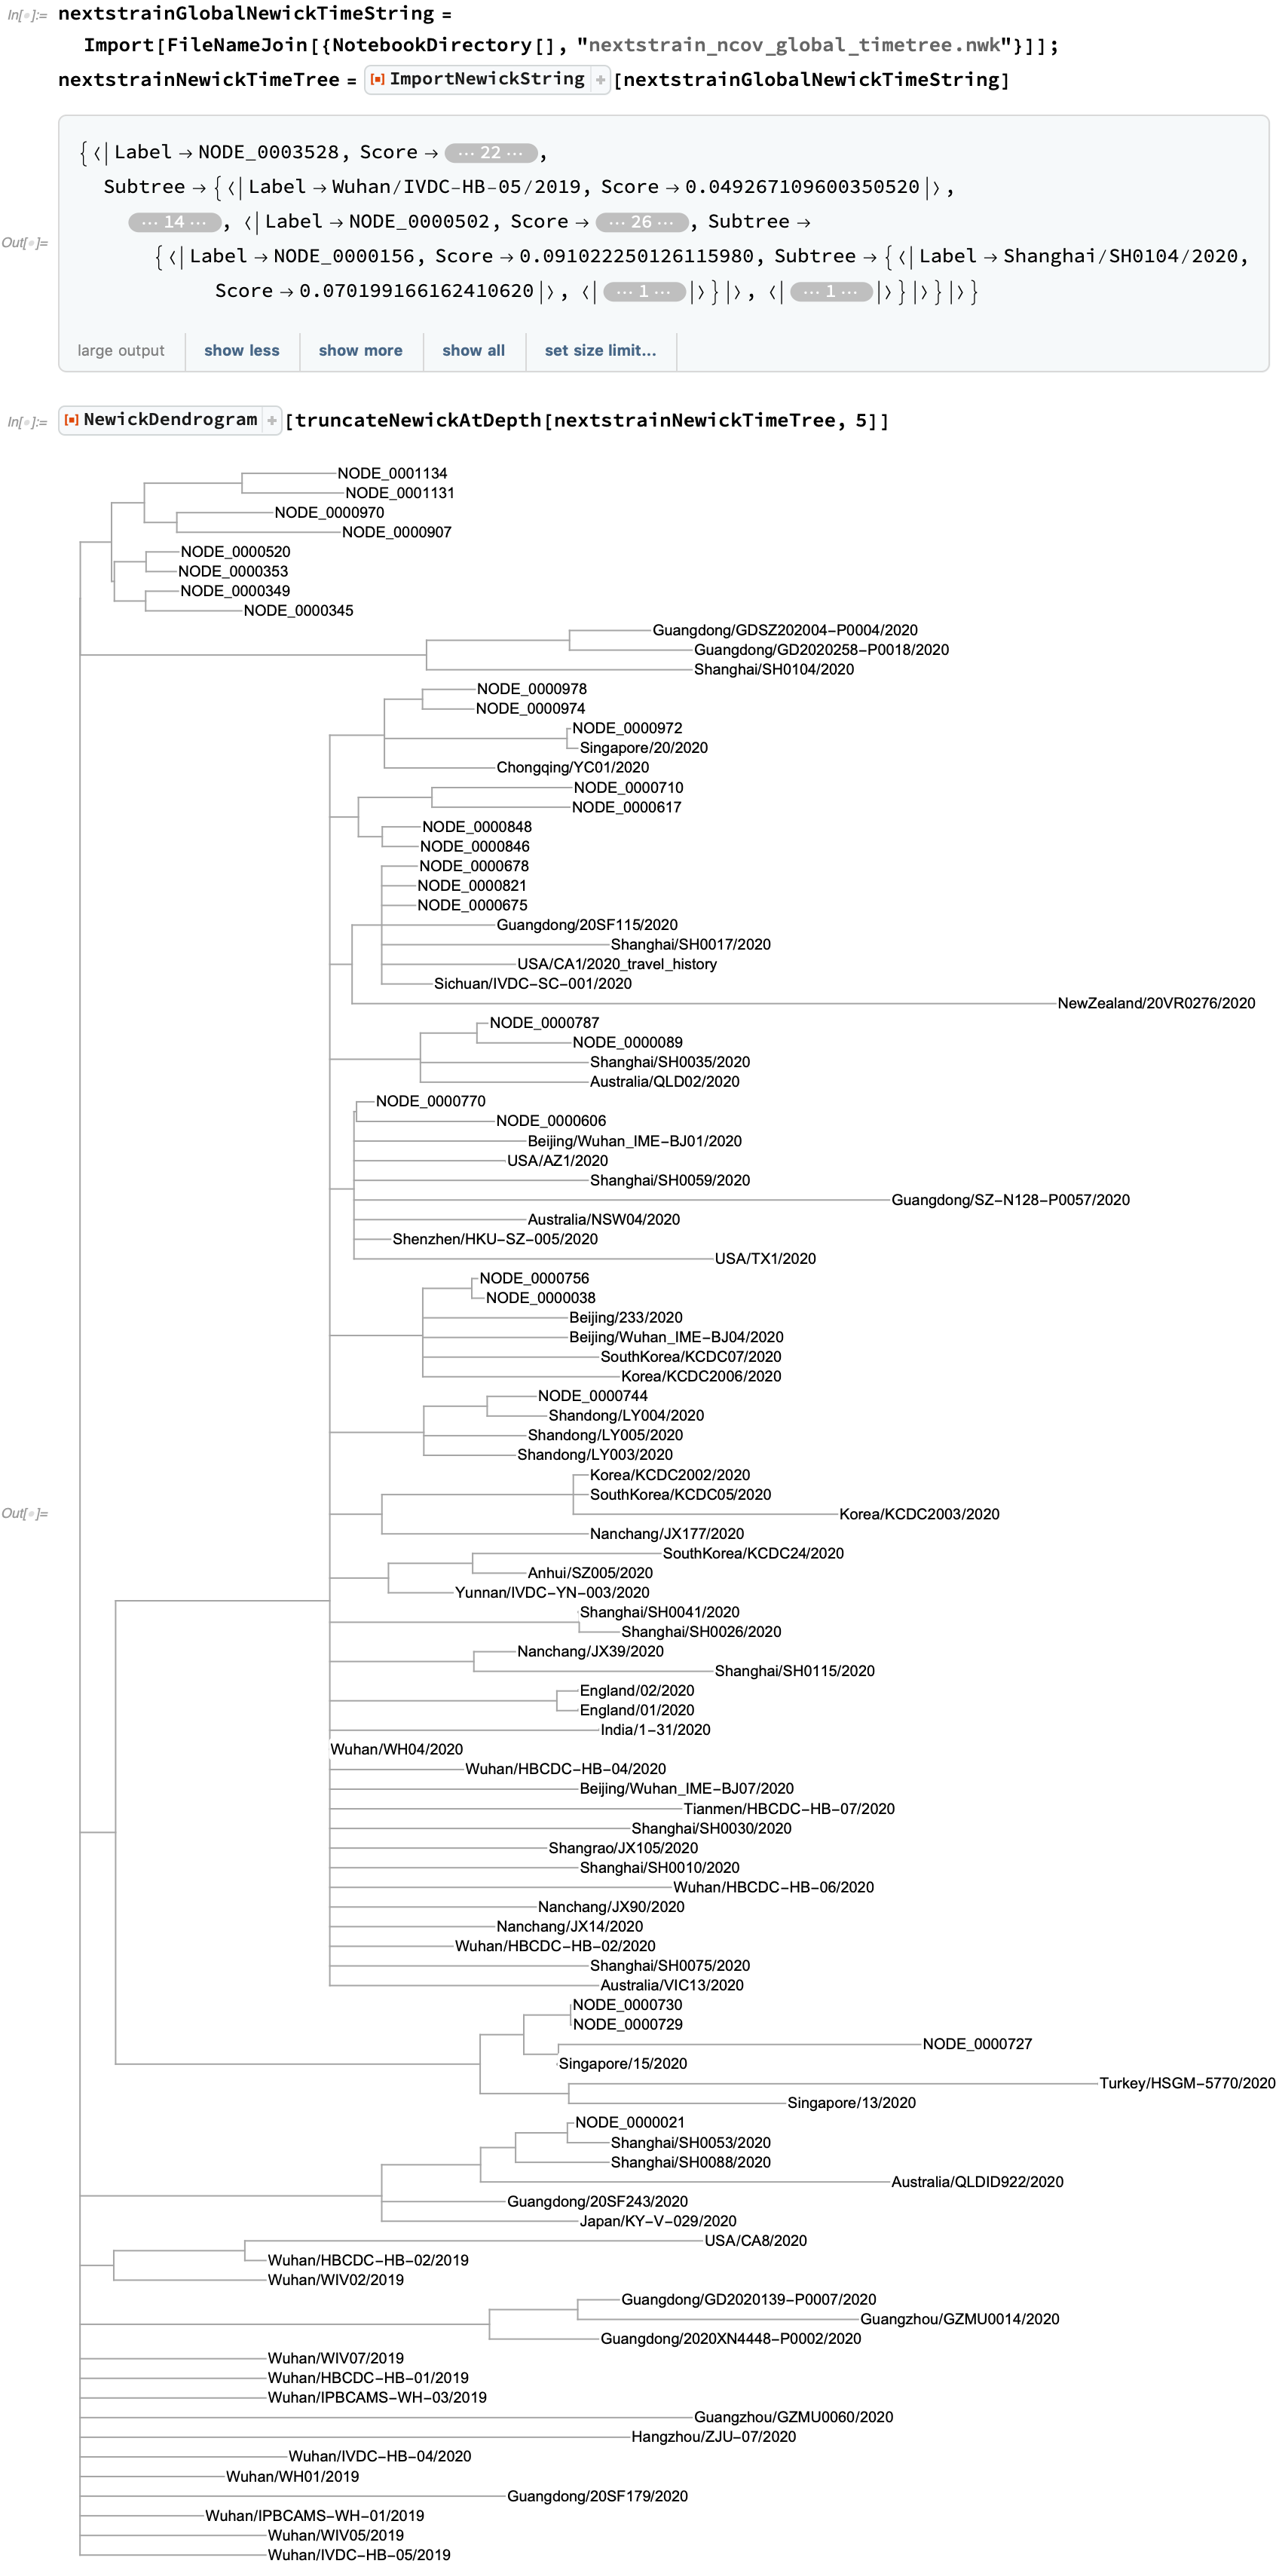
In addition to these trees, quite a bit of metadata is supplied for each strain, which is easy to enrich with semantics: 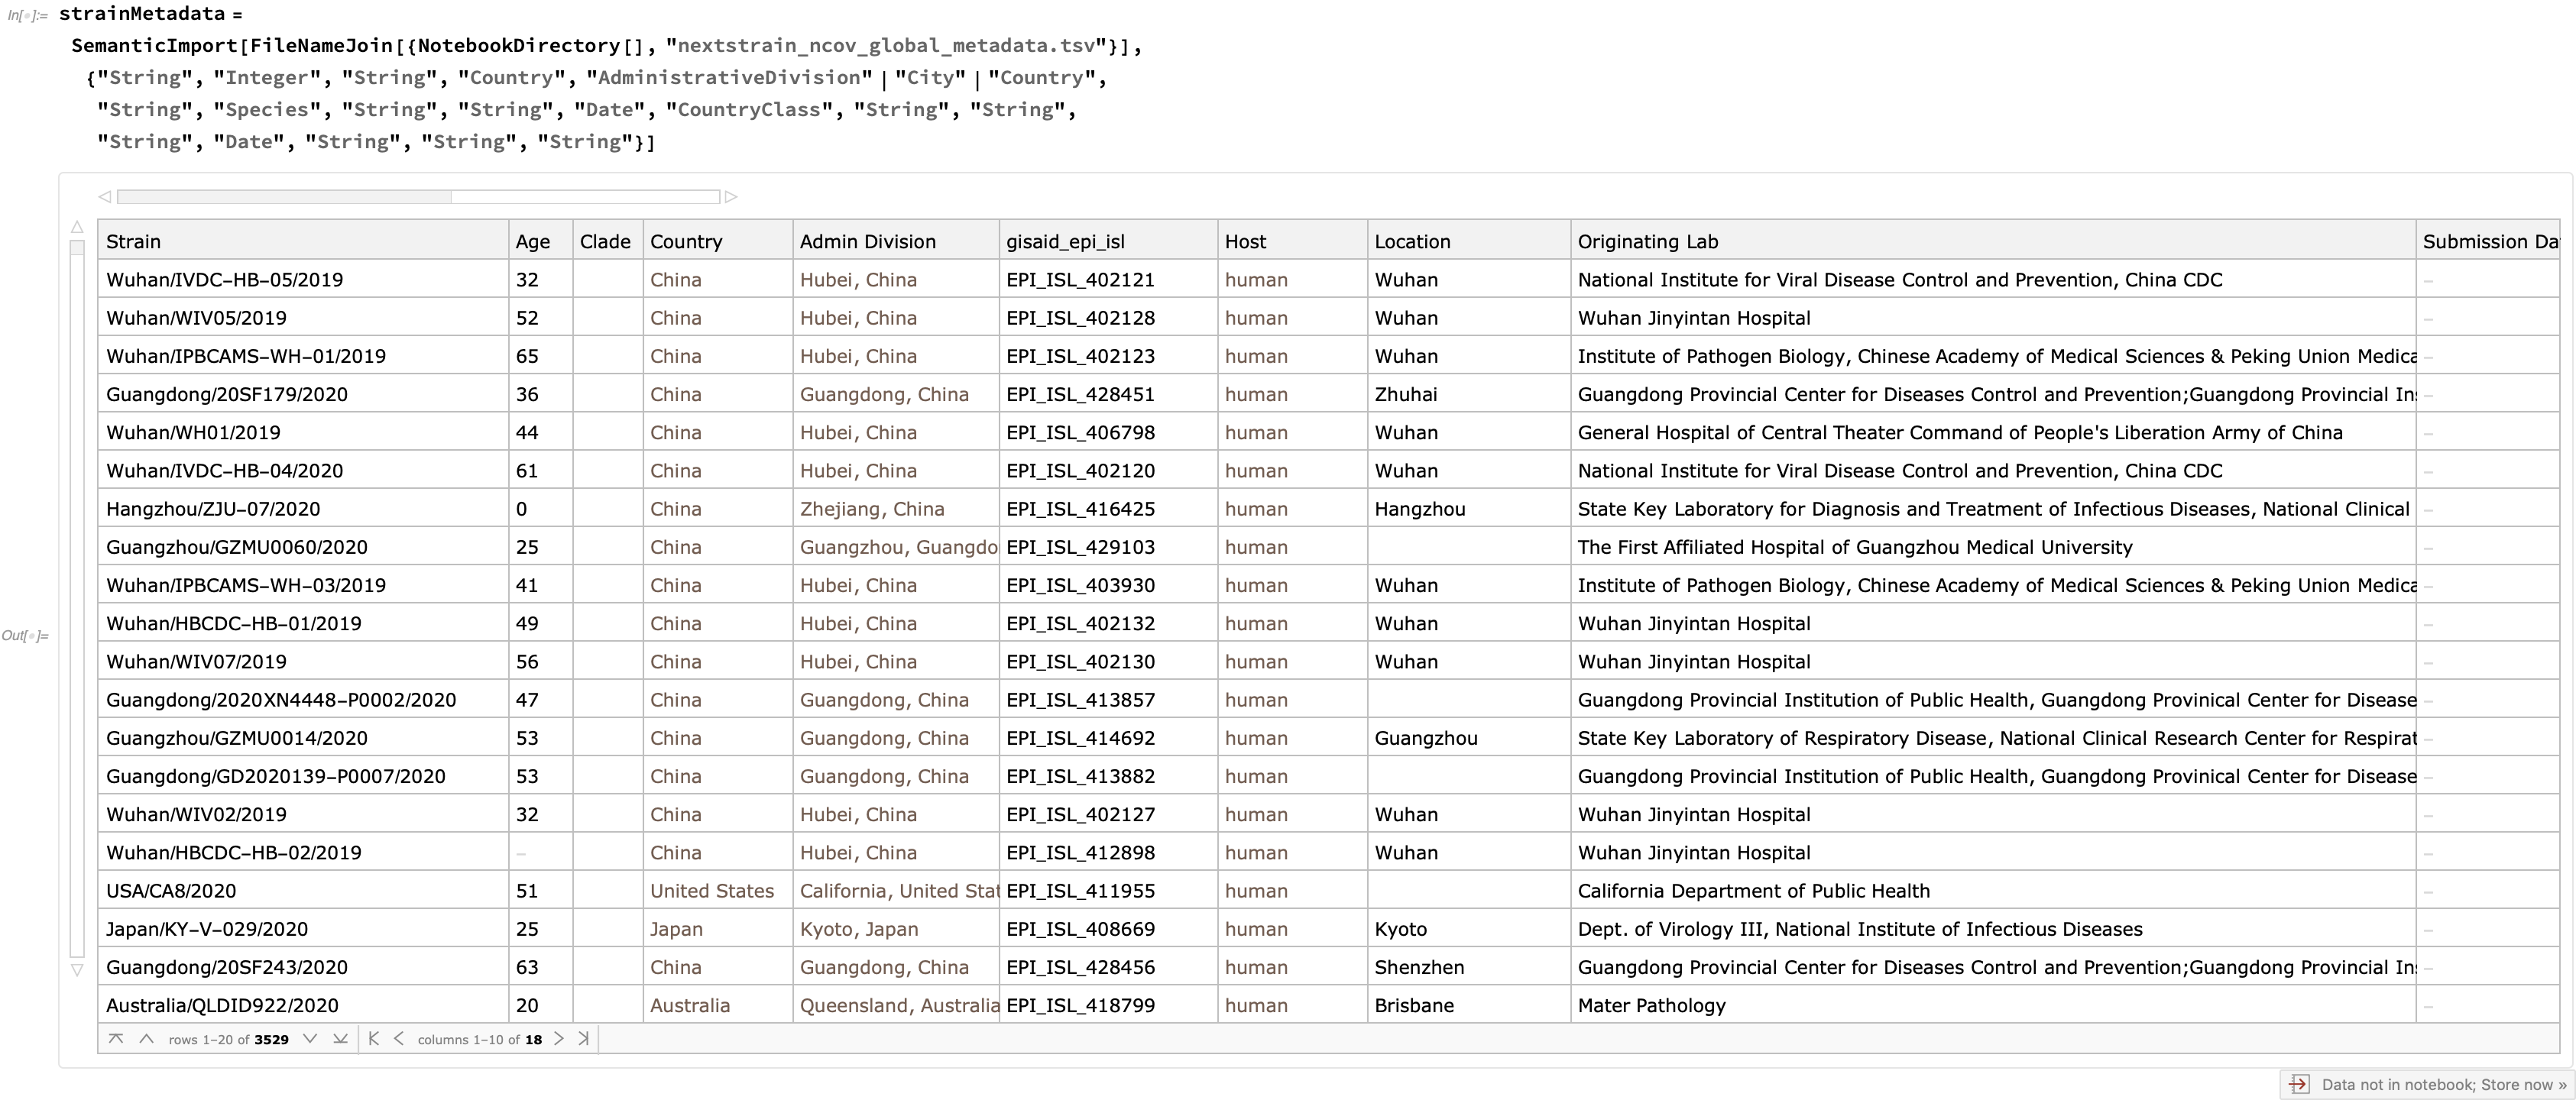
Using this metadata, let's try to show a bit of how the virus spread. First, let's construct an association from the strain to the administrative division: 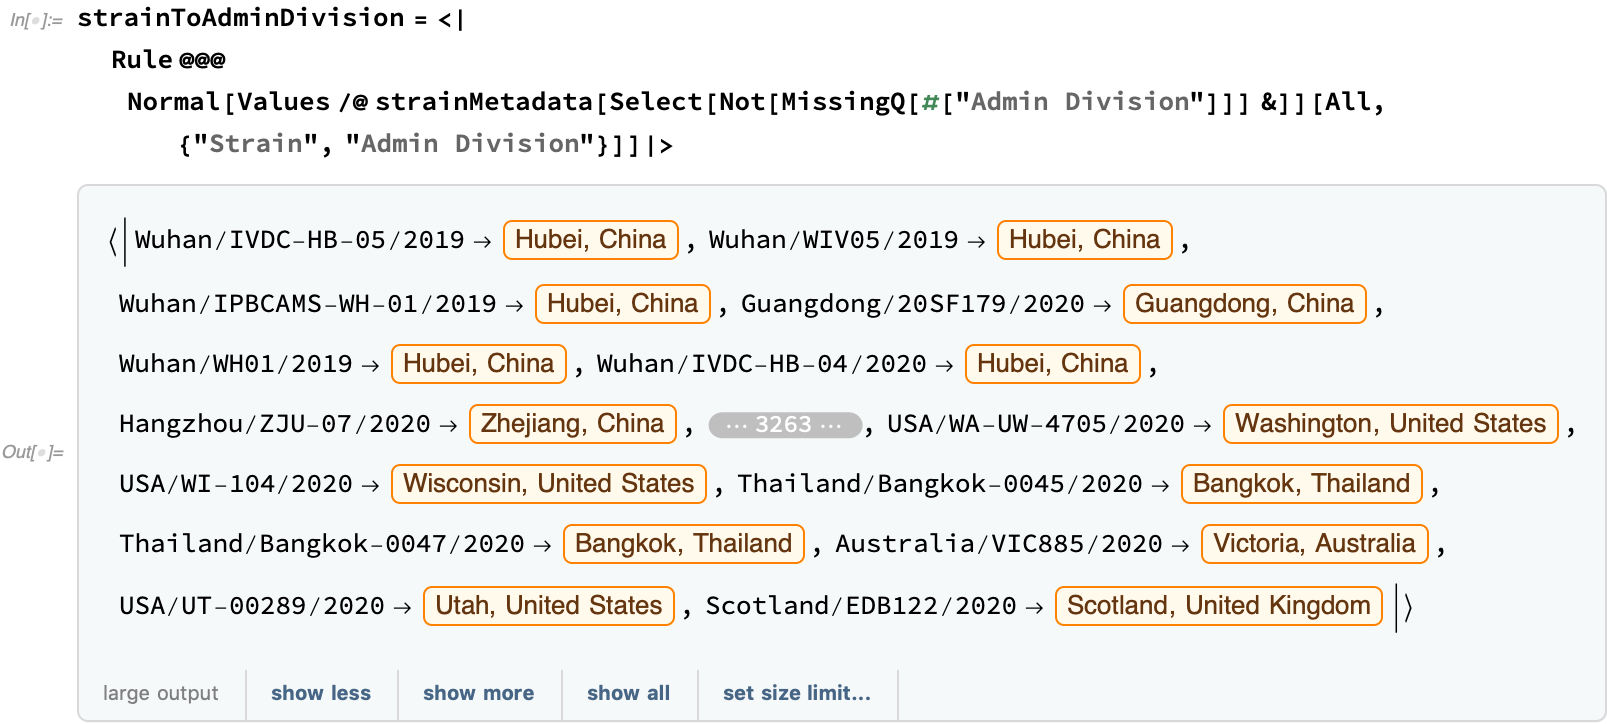
By mapping the strains to administrative division and using a queue to create a breadth-first traversal of the time tree, we build a rough approximation of the progression of the spread of COVID-19: 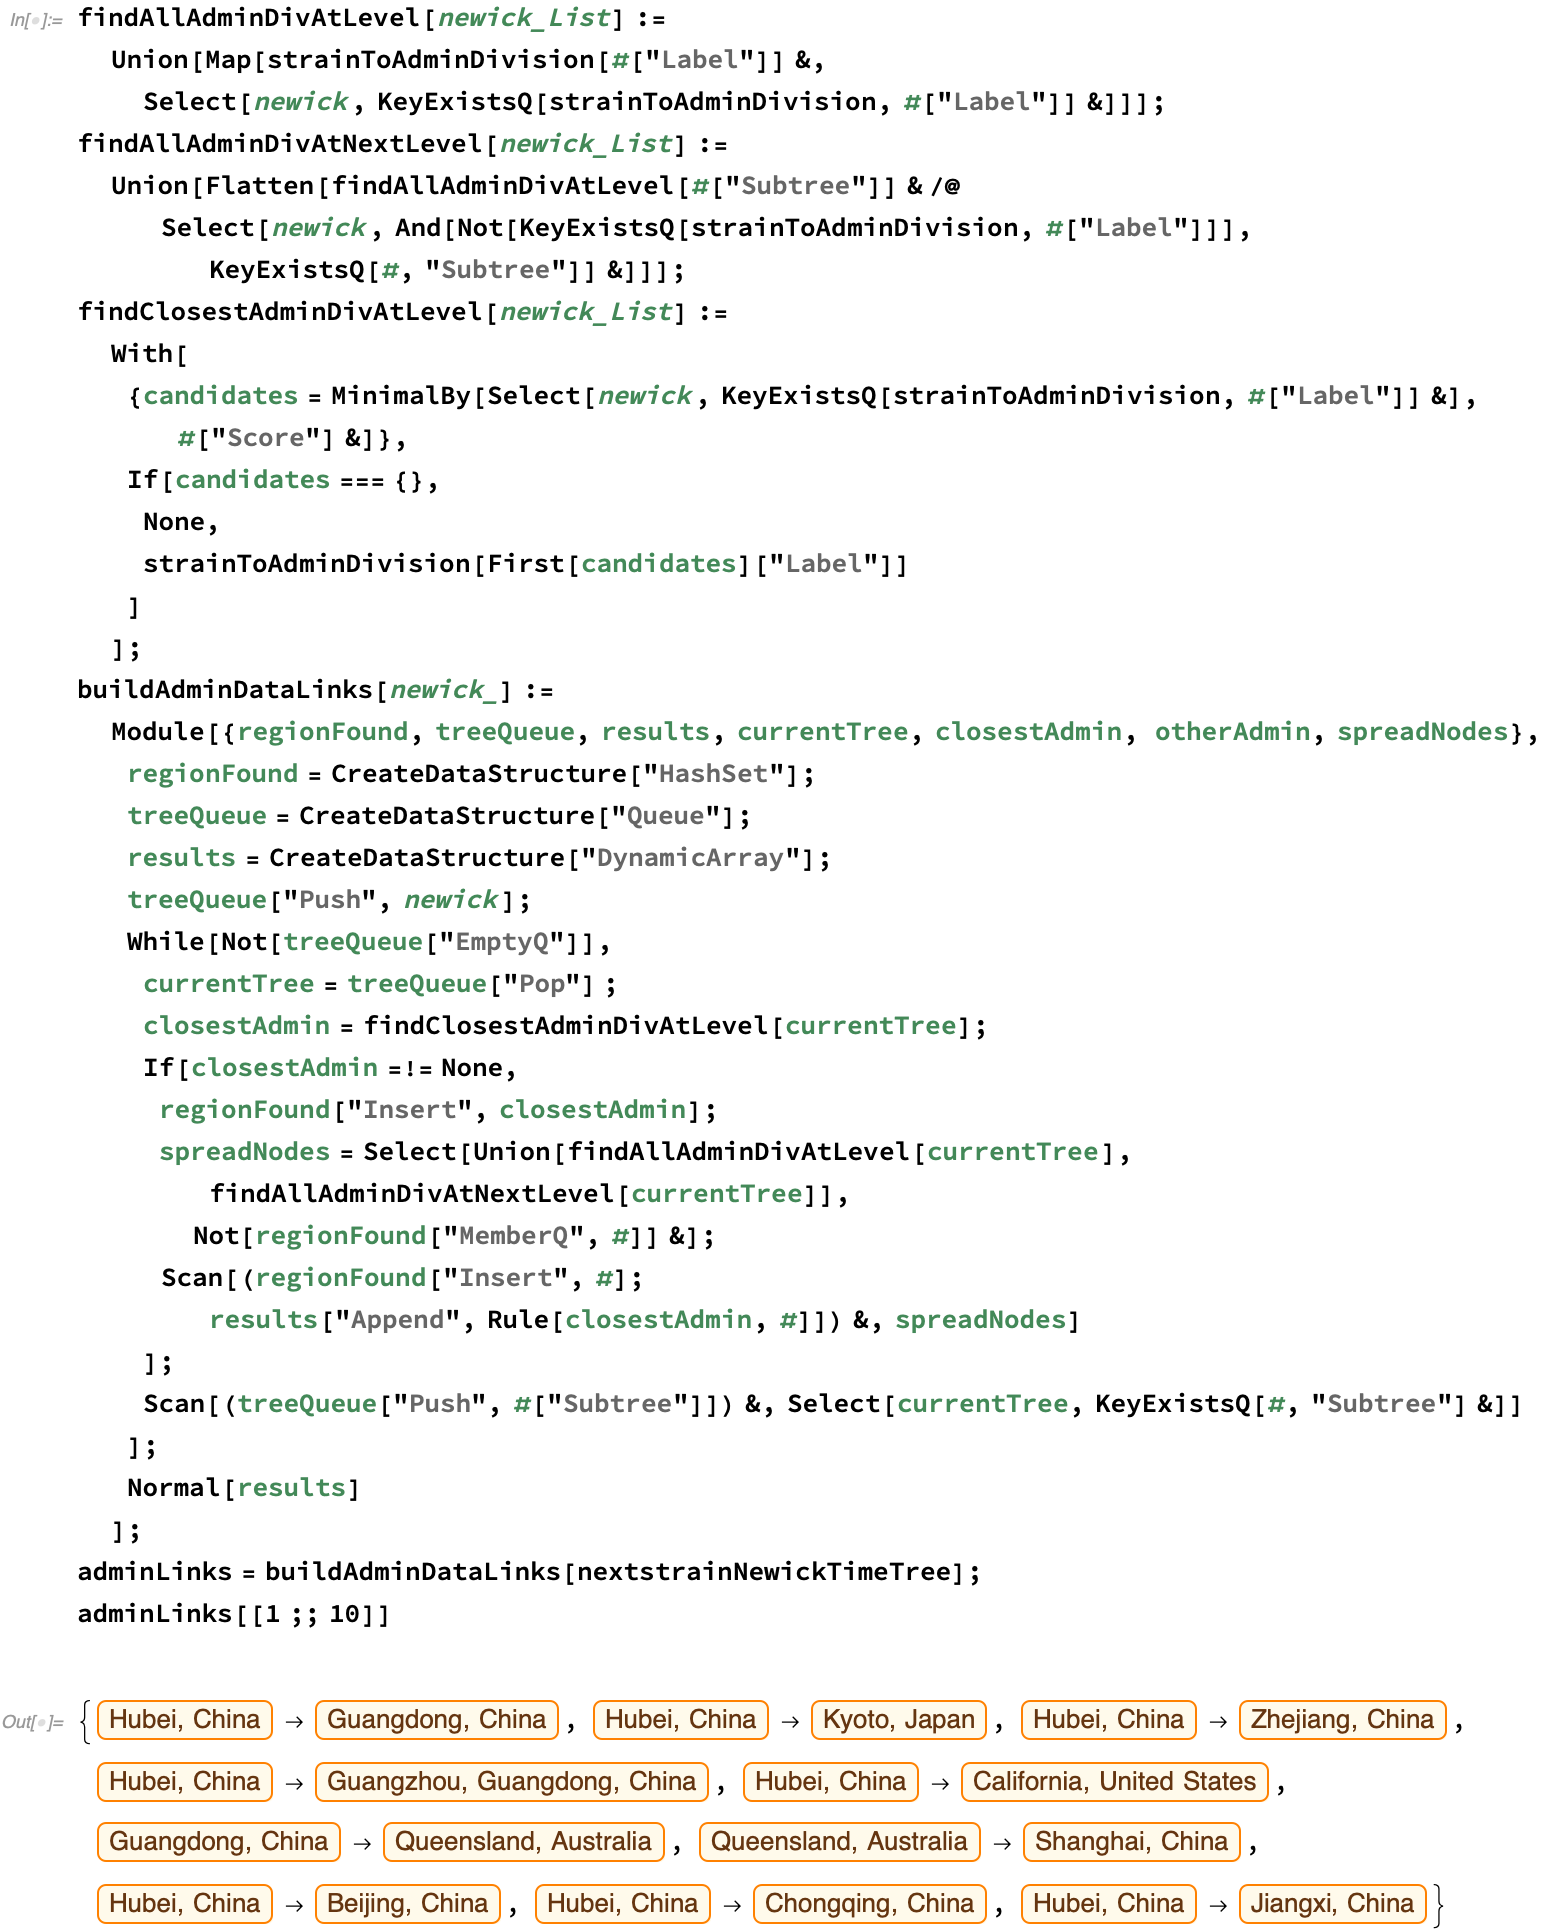
We can plot this spread on a map, approximating the first fifty regional links of the viral progression: 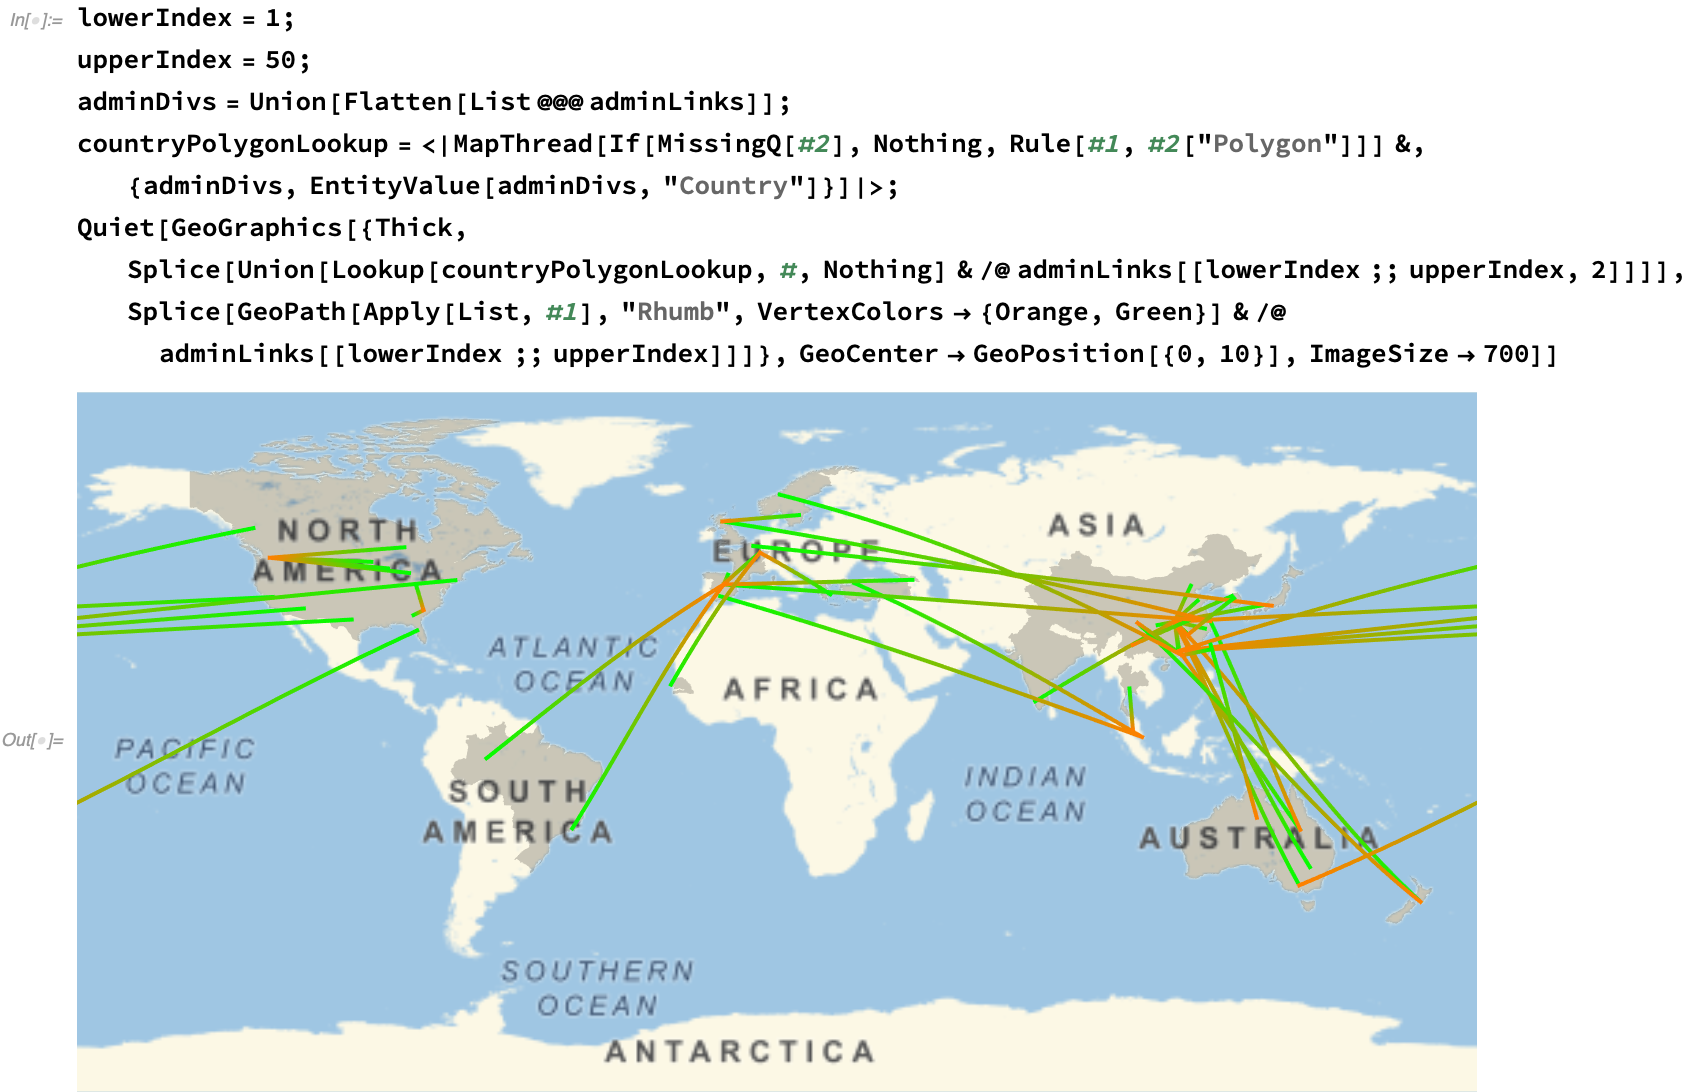
Via a manipulate, we can get an overall feel of the progression at different stages: 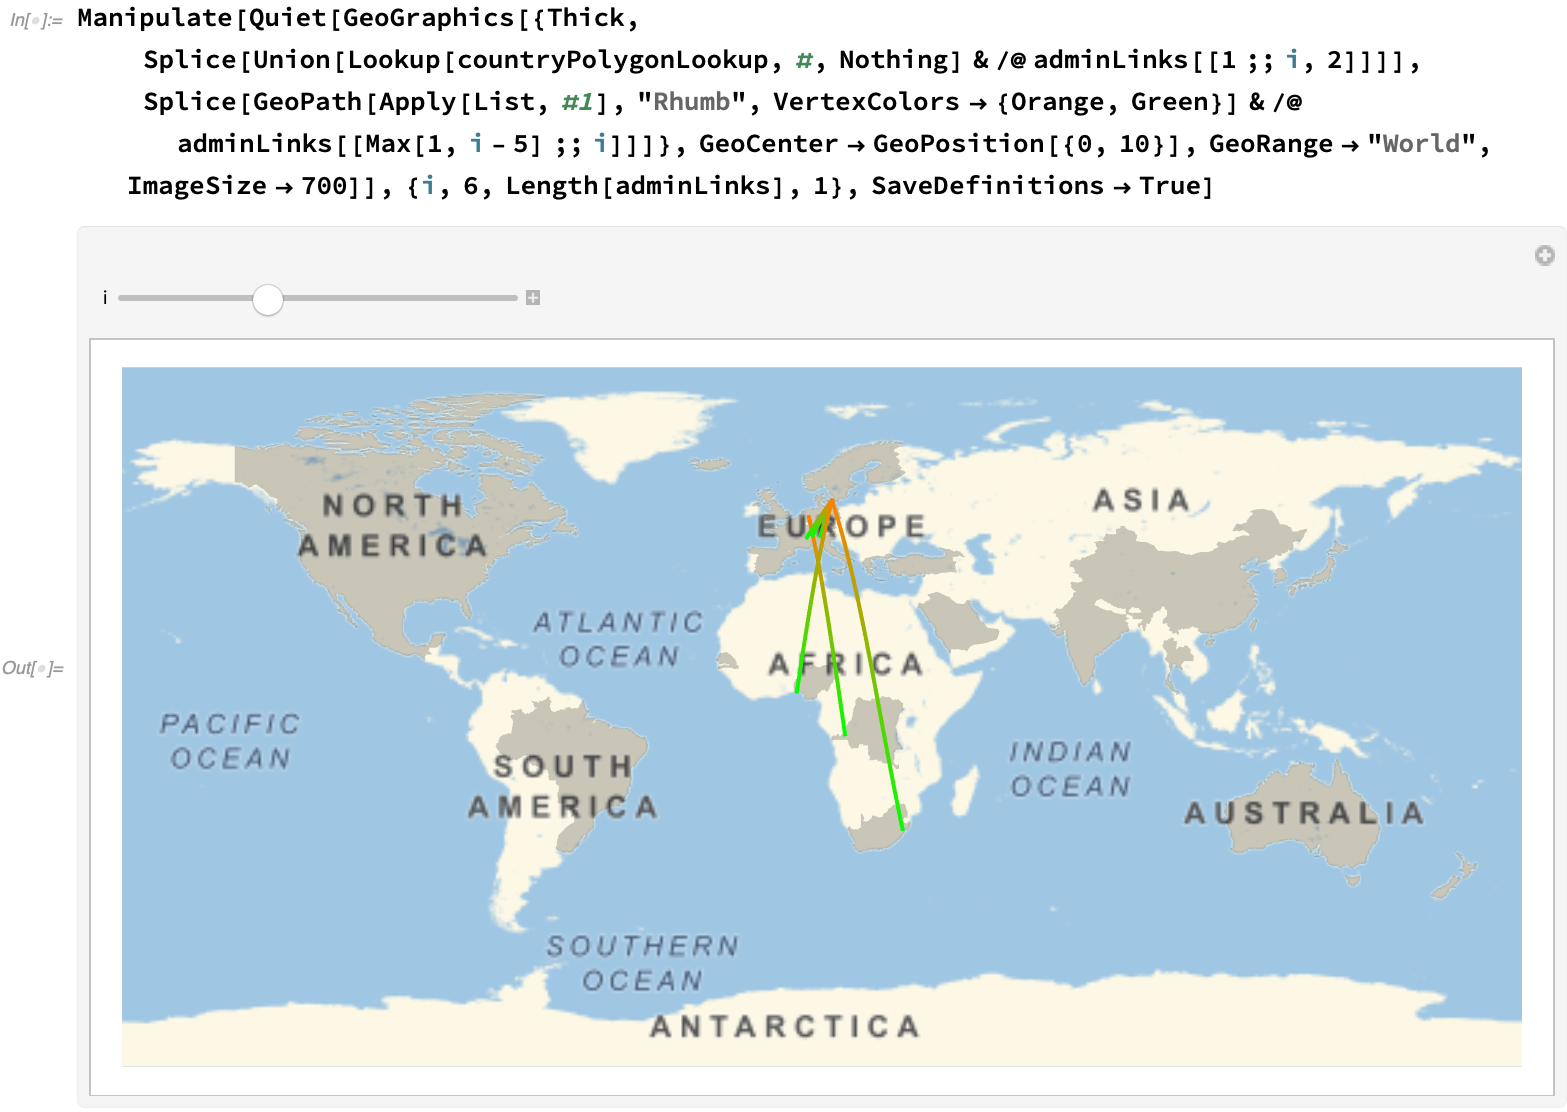
Finally, let's take the opportunity to give credit for these resources. First, let's import the authors who have submitted the data. This file is one of the means by which they are given credit for providing their data to coordinated epidemiological efforts: 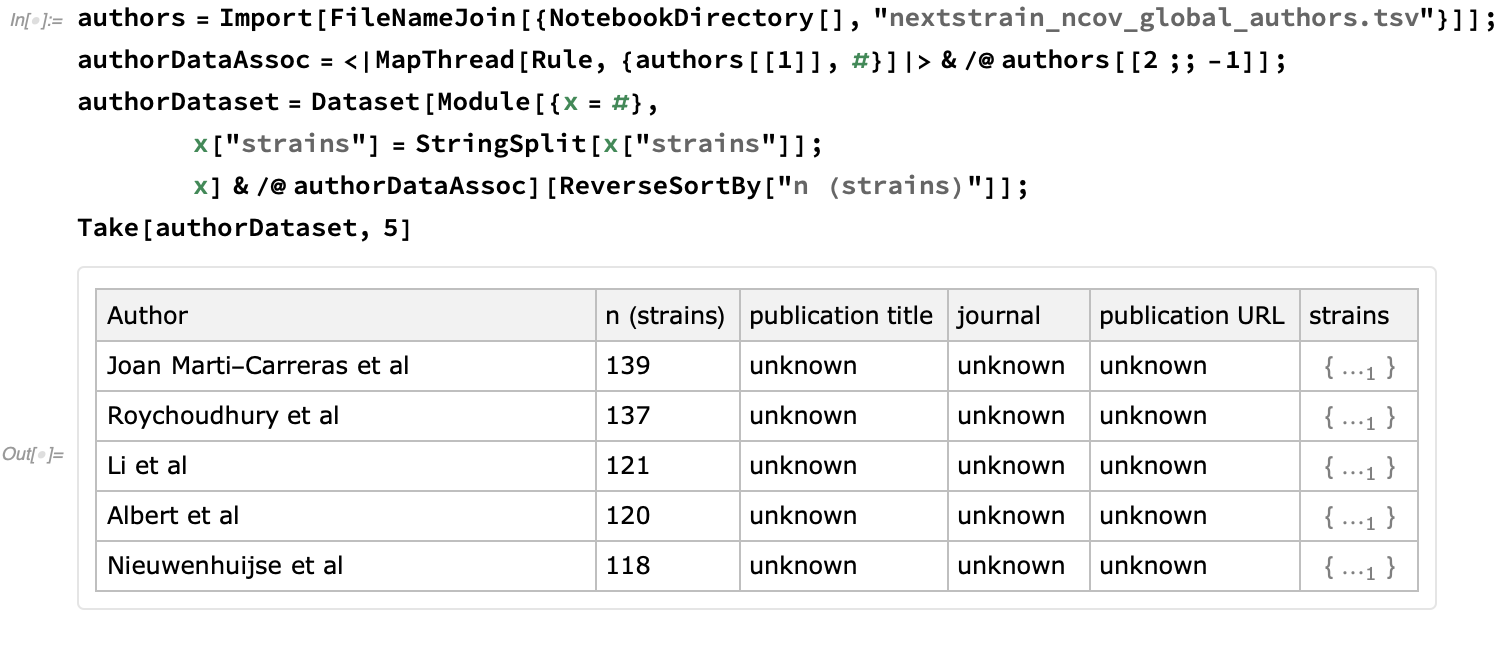
We see that this Dataset currently incorporates 3529 strains: 
We see that the number of strains submitted per lab has a flat tail, with about half of the data be provided by the 10% most prodigious authors: 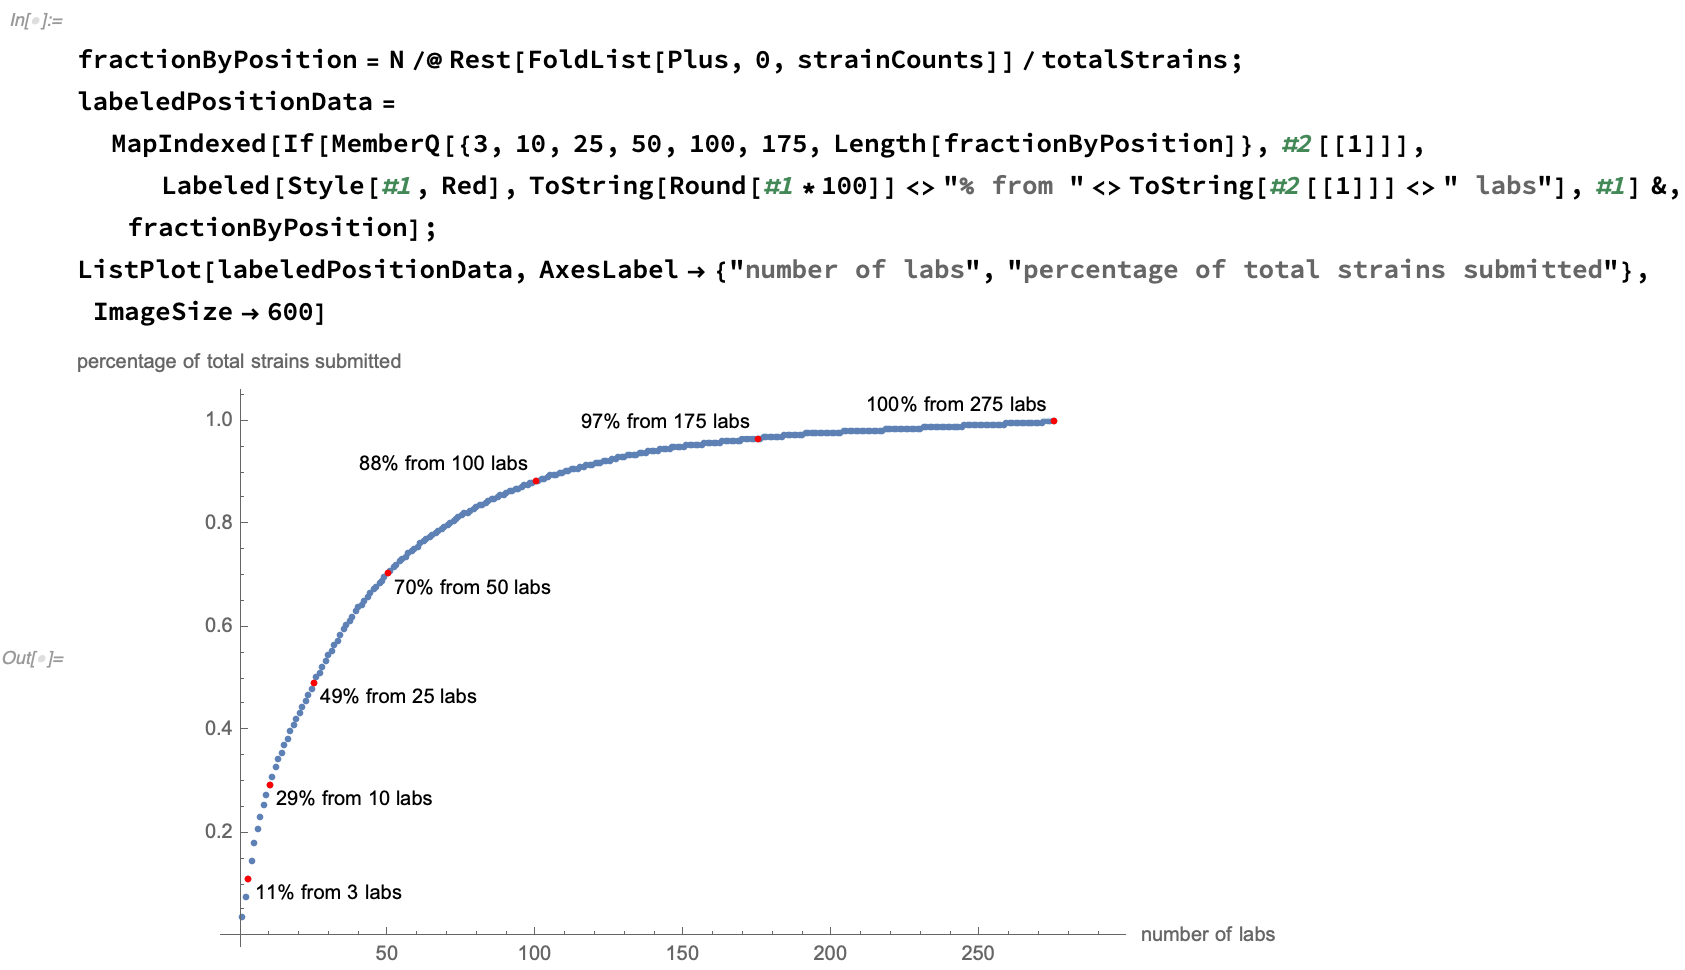
Of course, we should conclude by crediting these resources themselves:
Hadfield et al, Nextstrain: real-time tracking of pathogen evolution, Bioinformatics (2018)
Sagulenko et al, TreeTime: Maximum-likelihood phylodynamic analysis, Virus Evolution (2017)
We look forward to seeing what further work you might undertake given the functionality shown here, as well as other Wolfram Language phylogenetic resources!
(Thanks to M.T., D.L., and C.P. for reviews of a draft of this post. While it is better for their comments, any remaining errors or omissions are my own.)
 Attachments:


