Dear all, I am trying to make visualization of a parametrized real function using the command "vary" on the alpha online site. All I obtain is a picture of the plot with the "lever" for changing the parameter but I cannot interact with it. 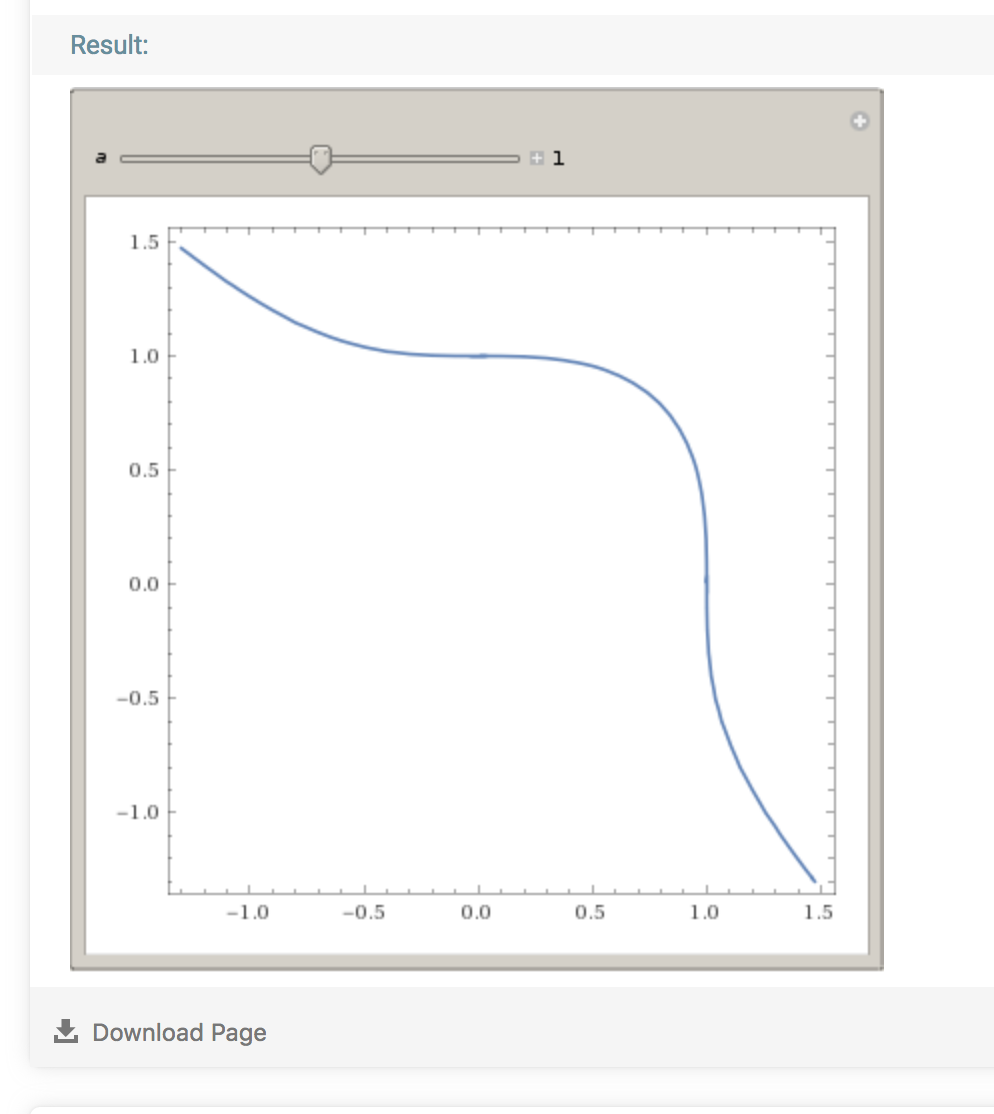
It is a problem of the open-version that does not support this functionality or am I missing something?
Thank you! RB


