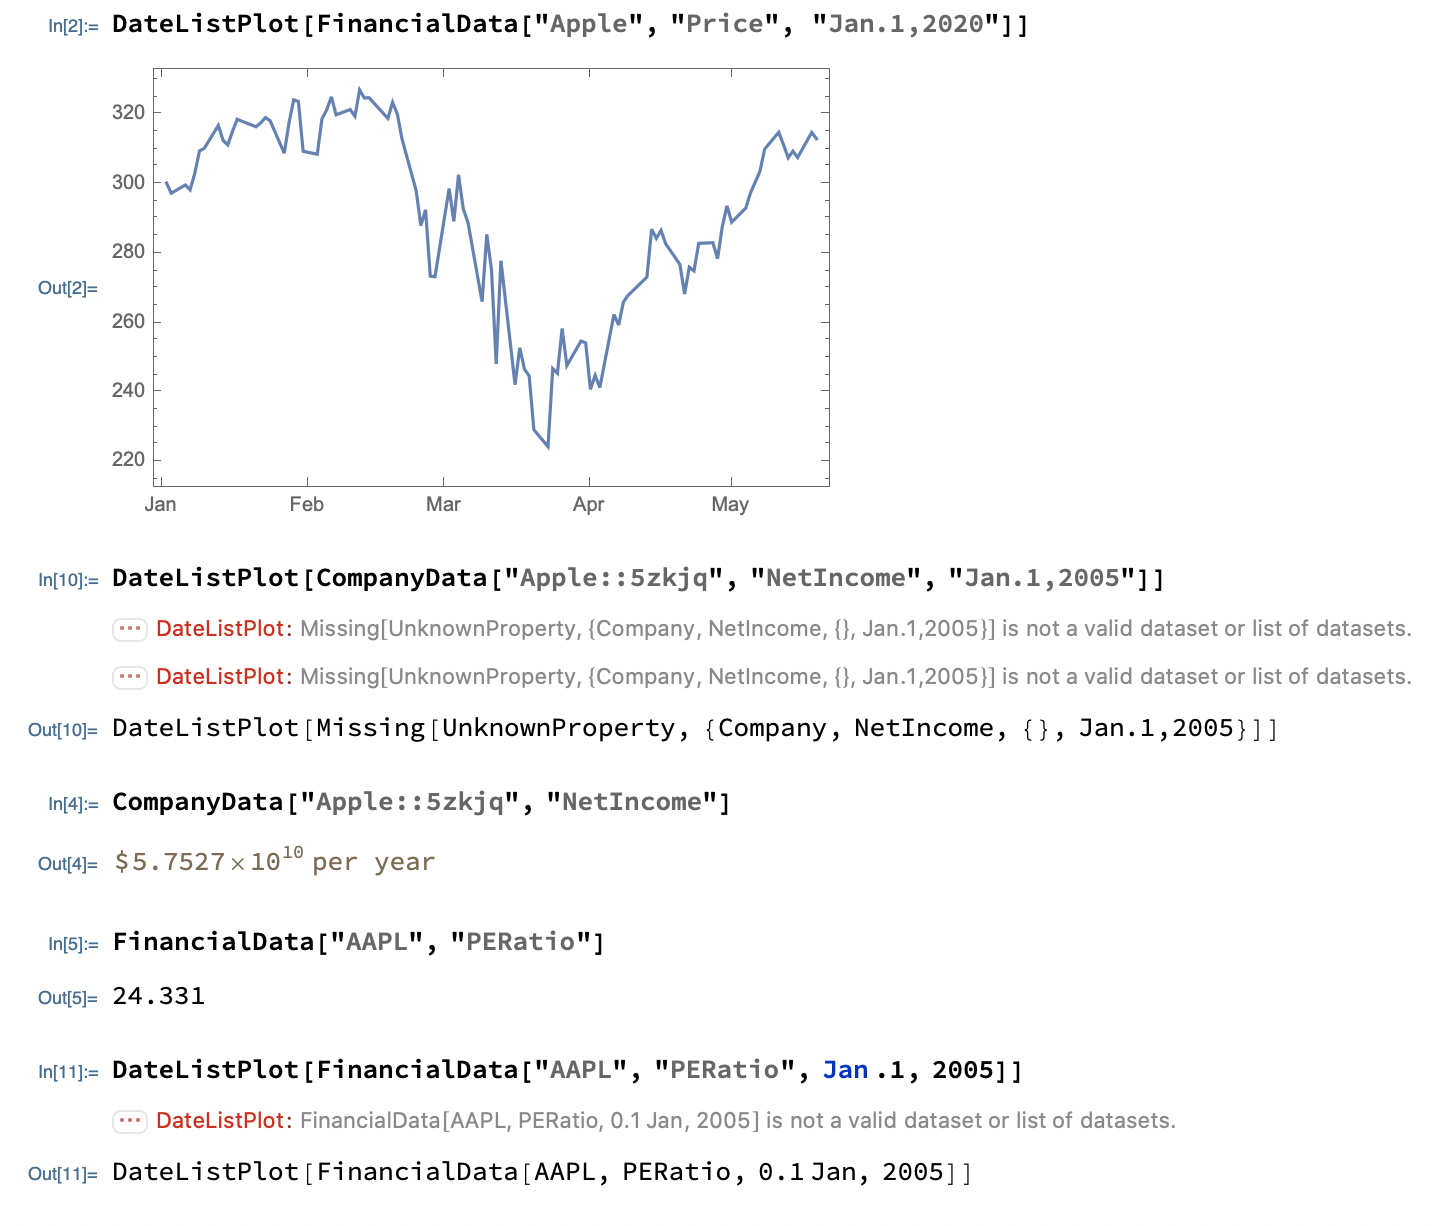
Hi everyone. I'm starting to learn about Mathematica Desktop, so forgive me if I am not explaining myself properly. As all of you may know, Mathematica differentiate between Financial Data and Company Data. If your write FinancialData["AAPL","Properties"] you will obtain data such price, adjusted price and so on. However, is you write CompanyData["Apple::5zkjq", "Properties"] you will obtain data such as: Accounts receivable, accounts payable, net income...Basically, all related with the fundamental analysis of the company. My question is, it is possible to plot in a Date list graph Company Data? If you write DateListPlot[FinancialData["Apple", "Price", "Jan.1,2020"]] there is no error but if you write DateListPlot[CompanyData["Apple::5zkjq", "NetIncome", "Jan.1,2005"]] you will get the following error DateListPlot::ldata: Missing[UnknownProperty,{Company,NetIncome,{},Jan.1,2005}] is not a valid dataset or list of datasets. And the same happen if you try it with different Company properties such as DateListPlot[FinancialData["AAPL", "PERatio", Jan .1, 2020]] What I am doing wrong? Is Company Data plotted in a different way? Here is a screenshot of my notebook. Thank you guys.