Thank you!
Hi Katharina,
Around expects two arguments not a List with two elements.
Around
List
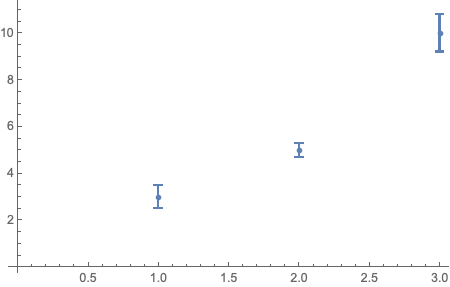
data = {{3, .5}, {5, .3}, {10, .8}};
ListPlot[Around @@@ data]