Message Boards Message Boards

0
|
2574 Views
|
4 Replies
|
1 Total Likes
View groups...
Share
Share this post:

Displaying 27 lines on a Clebsch surface

Posted 4 years ago

Hi all,

I was able to follow another example posted somewhere on these forums to get Mathematica to render a Clebsch surface using the following:

clebsch[x_, y_, z_] := 
 81 (x^3 + y^3 + z^3) - 9 (x^2 + y^2 + z^2) - 
  189 (x^2 y + x^2 z + x y^2 + x z^2 + y^2 z + y z^2) + 54 x y z - 
  9 (x + y + z) + 126 (x y + x z + y z) - 1

ContourPlot3D[clebsch[x, y, z] == 0, {x, -2, 2}, {y, -2, 2}, {z, -2, 2}]

But I was wondering it is possible to draw the 27 lines present on any smooth cubic surface like here: https://blogs.ams.org/visualinsight/2016/02/15/27-lines-on-a-cubic-surface/

Furthermore if you can draw those lines, is it possible export this to a 3D file?

Any help would be greatly appreciated!

Many thanks.

POSTED BY: Alex Turner
4 Replies

This topic is fun! Here are some models suitable for printout; with the above definitions of lines and clebsch:

(* points where each line intersects with the sphere *)
pointPairsOnSphere = N[# /. Solve[Norm[#] == 1, t] & /@ lines];
tubes = Graphics3D[{Tube[#, .04] & /@ pointPairsOnSphere}];
cl3DThick = ContourPlot3D[clebsch[x, y, z] == 0, {x, y, z} \[Element] Ball[{0, 0, 0}, 1.03], RegionBoundaryStyle -> None, Mesh -> None, Boxed -> False, Axes -> False, PlotTheme -> "ThickSurface"];
Show[cl3DThick, tubes, ImageSize -> Large]

enter image description here

pointsOnSphere = Flatten[pointPairsOnSphere, 1];
order = Last@FindShortestTour[pointsOnSphere];
curve = ListInterpolation[#, {0, 1}] & /@ Transpose[pointsOnSphere[[order]]];
curveData = Table[Through[curve[t]], {t, 0, 1, .005}];
Graphics3D[{Red, Tube[curveData, .05], Green, Tube[#, .04] & /@ pointPairsOnSphere}, ImageSize -> Large, Boxed -> False]

enter image description here

POSTED BY: Henrik Schachner

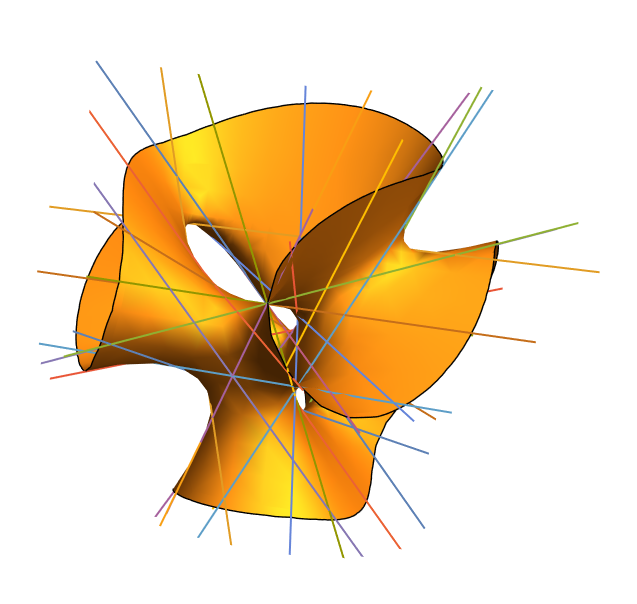
OK, I found the parameters of the lines on this nice site. In the most simple way one can show them like so:

l1 = {{1, \[Minus]1, 0} t + {0, 0, \[Minus]1/3},
   {1, 0, \[Minus]1} t + {0, \[Minus]1/3, 0},
   {0, 1, \[Minus]1} t + {\[Minus]1/3, 0, 0},
   {1, \[Minus]1, 0} t + {1/6, 1/6, 0},
   {1, \[Minus]1, 0} t + {1/3, 1/3, 1/3},
   {1, 0, \[Minus]1} t + {1/6, 0, 1/6},
   {1, 0, \[Minus]1} t + {1/3, 1/3, 1/3},
   {0, 1, \[Minus]1} t + {0, 1/6, 1/6},
   {0, 1, \[Minus]1} t + {1/3, 1/3, 1/3},
   {3, 0, 1} t + {1/6, 0, 1/6},
   {3, 1, 0} t + {1/6, 1/6, 0},
   {0, 3, 1} t + {0, 1/6, 1/6},
   {1, 3, 0} t + {1/6, 1/6, 0},
   {0, 1, 3} t + {0, 1/6, 1/6},
   {1, 0, 3} t + {1/6, 0, 1/6}};

l2 = {{1 + 3/Sqrt[5], \[Minus](1/Sqrt[5]), 1} t + {(5 + Sqrt[5])/
      30, (5 + 3 Sqrt[5])/30, 0},
   {\[Minus](1/Sqrt[5]), 1 + 3/Sqrt[5], 1} t + {(5 + 3 Sqrt[5])/
      30, (5 + Sqrt[5])/30, 0},
   {\[Minus]3 - Sqrt[5], \[Minus]Sqrt[5], 1} t + {(7 + 3 Sqrt[5])/
      6, (3 + Sqrt[5])/6, 0},
   {(\[Minus]3 + Sqrt[5])/4, (\[Minus]5 + 3 Sqrt[5])/4, 
      1} t + {(3 + Sqrt[5])/12, (1 - Sqrt[5])/12, 0},
   {(\[Minus]5 - 3 Sqrt[5])/4, (\[Minus]3 - Sqrt[5])/4, 
      1} t + {(1 + Sqrt[5])/12, (3 - Sqrt[5])/12, 0},
   {Sqrt[5], \[Minus]3 + Sqrt[5], 1} t + {(3 - Sqrt[5])/
      6, (7 - 3 Sqrt[5])/6, 0},
   {\[Minus]Sqrt[5], \[Minus]3 - Sqrt[5], 1} t + {(3 + Sqrt[5])/
      6, (7 + 3 Sqrt[5])/6, 0},
   {(\[Minus]5 + 3 Sqrt[5])/4, (\[Minus]3 + Sqrt[5])/4, 
      1} t + {(1 - Sqrt[5])/12, (3 + Sqrt[5])/12, 0},
   {(\[Minus]3 - Sqrt[5])/4, (\[Minus]5 - 3 Sqrt[5])/4, 
      1} t + {(3 - Sqrt[5])/12, (1 + Sqrt[5])/12, 0},
   {\[Minus]3 + Sqrt[5], Sqrt[5], 1} t + {(7 - 3 Sqrt[5])/
      6, (3 - Sqrt[5])/6, 0},
   {1/Sqrt[5], 1 - 3/Sqrt[5], 1} t + {(5 - 3 Sqrt[5])/
      30, (5 - Sqrt[5])/30, 0},
   {1 - 3/Sqrt[5], 1/Sqrt[5], 1} t + {(5 - Sqrt[5])/
      30, (5 - 3 Sqrt[5])/30, 0}};

lines = Join[l1, l2];

plines = ParametricPlot3D[Evaluate@lines, {t, -1, 1}];

clebsch[x_, y_, z_] := 
 81 (x^3 + y^3 + z^3) - 
  189 (x^2*y + x^2 z + y^2 x + y^2 z + z^2 x + z^2 y) + 54 (x y z) + 
  126 (x y + x z + y z) - 9 (x^2 + y^2 + z^2) - 9 (x + y + z) + 1

cl3D = ContourPlot3D[
   clebsch[x, y, z] == 0, {x, y, z} \[Element] Ball[{0, 0, 0}, 1], 
   RegionBoundaryStyle -> None, Mesh -> None, Boxed -> False, 
   Axes -> False];

Show[cl3D, plines]

enter image description here

POSTED BY: Henrik Schachner

Apart from drawing the lines - this post might be of interest to you.

POSTED BY: Henrik Schachner
Posted 4 years ago

Thankyou for all your help Henrik!

Really appreciated :)

POSTED BY: Alex Turner
Reply to this discussion
Community posts can be styled and formatted using the Markdown syntax.
Reply Preview
Attachments
Remove
or Discard

Group Abstract Group Abstract