Probably most of you heard the sad news that there was a giant explosion in the port of Beirut today August 3rd 2020. Several videos were released on which we can do analysis. Note that the method I will use was also famously used by G.I. Taylor to find the energy of the Trinity nuclear bomb test, and he found the right amount to within 10%! We will not be so lucky as the video quality was relatively poor as compared to the high-speed imaging done back then.
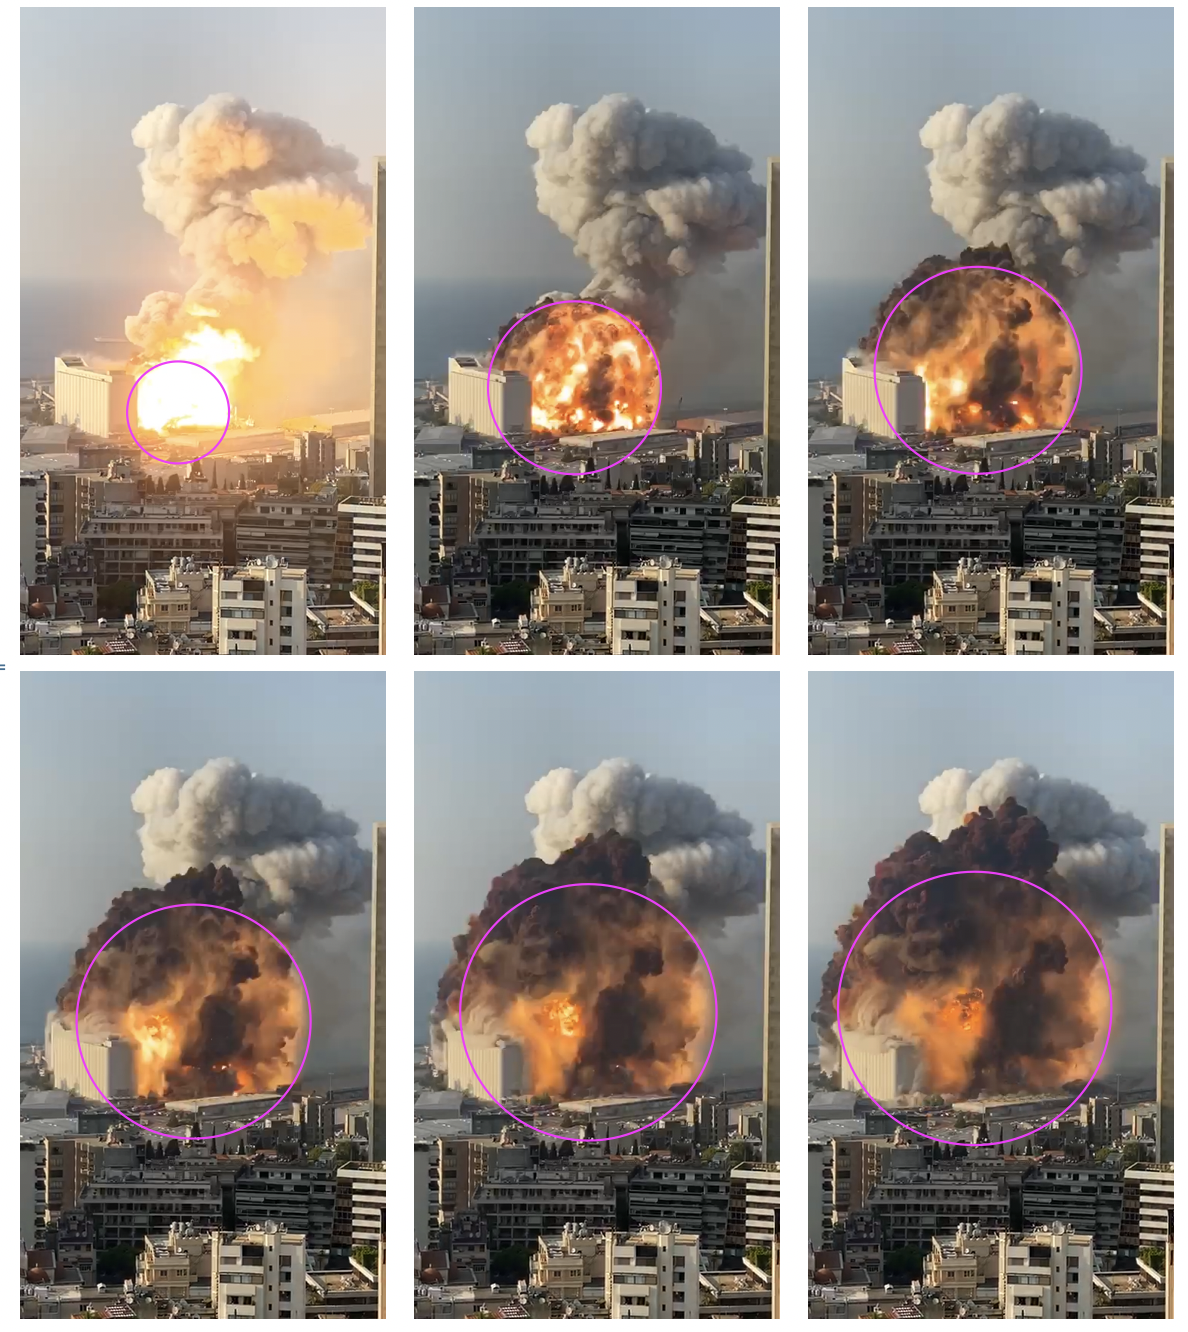
I extracted several frames from one of the videos:

SetDirectory[NotebookDirectory[]];
v1 = Import["1.mp4"];
fra = VideoExtractFrames[v1, Interval[{11, 12}]]
fra = ImageRotate[#, Right] & /@ fra;
For each of the frames I identified the explosion by clicking 3 point on the circle:
 data={
{7,{{157.15625,365.20703125000006`},{233.83984375,379.76562500000006`},{272.015625,312.91015625000006`}}},
{8,{{318.16796874999994`,322.81640625000006`},{228.7890625,462.8515625},{103.61328125,393.38281250000006`}}},
{9,{{341.03515625000006`,311.34765625},{308.27734375,478.125},{93.86328125,420.34375}}},
{10,{{359.08984375,315.546875},{351.48828125,478.63671875000006`},{86.55078125,454.5078125}}},
{11,{{375.62109375,325.64453125},{330.05859375,535.3984375},{62.0390625,434.51171875}}},
{12,{{376.0390625,326.765625},{337.94140625,539.9257812499999},{46.4140625,462.55859375}}}
};
The first is the index of the frames, the last elements are points of the circle:
circs = CircleThrough /@ data[[;; 6, 2]];
r = circs[[All, 2]];
Here is the visualization:
Table[HighlightImage[fra[[data[[i, 1]]]], circs[[i]], "Boundary"], {i, Length[data]}]

Notice that I tracked the orange 'glow', not the shockwave or the smoke that was there partially before the main explosion (so on the conservative side and underestimating the energy release).
From Google earth I estimated the size of the face of the building on the left (a grain elevator) and found that every pixel corresponds to 0.59 m roughly (~22 meters corresponding to ~37 pixels).
cali = 0.5888486673789164`;
realr = r cali
The timestamps can be found from the video framerate.
Information[Import["video.mp4"]].
And so the timestamps are created and the dataset is created:
t = (Range[0, Length[realr] - 1]) 1/29.97;
tr = Transpose[{t, realr}]
Since the explosion started between two frames we include that in the fit (the t0):
fit = FindFit[
  tr, { a (x + t0)^0.4, 0 < t0 < 1/30}, {{a, 200}, {t0, 1/60}}, x]
realfit = a (x + t0)^0.4 /. fit
tzero = t0 /. fit
realfitshifted = a (x)^0.4 /. fit
prefactor = a /. fit
The fit can be found here and is based on dimensional analysis with the variable E (energy), r (radius of the explosion), t (time), and ρ (density). This also explains the exponent 0.4 used for fitting.
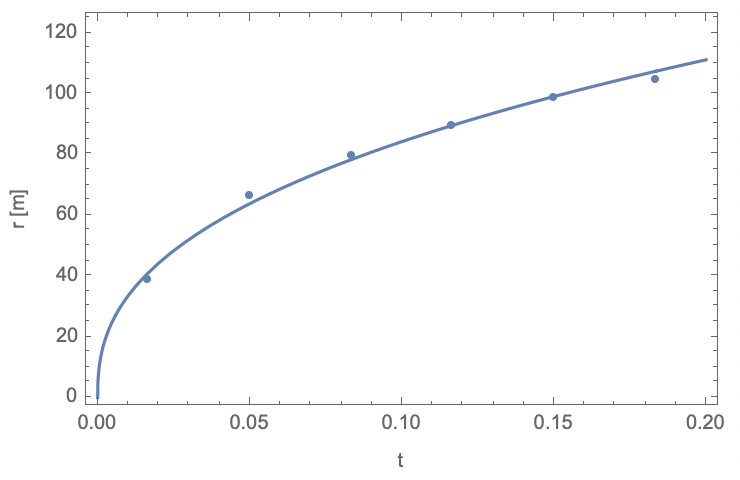
We plot the data and the fit:
Show[{ListPlot[Transpose[{t + tzero, realr}]],
  Plot[realfitshifted, {x, 0, 0.2}]},
 PlotRange -> {{0, 0.2}, {0, 120}}, Frame -> True,
 FrameLabel -> {"t", "r [m]"}]

Which is a pretty good fit.
We can now calculate the energy back from the explosion:
ClearAll[r, e, t, \[Rho]]
r == (e t^2/\[Rho])^(1/5)
Refine[DivideSides[%, t^(2/5)], t > 0]
%[[2]] == Quantity[prefactor, "Meters"/"Seconds"^(2/5)]
% /. \[Rho] -> Quantity[1, "Kilograms"/"Meters"^3]
energy = e /. Solve[%, e][[1]]
Yielding:
Quantity[4.2808721214488837`*^11, "Joules"]
and we can convert it to kiloton of TNT:
UnitConvert[energy, "KilotonsOfTNT"]
yielding:
Quantity[0.102315, "KilotonsOfTNT"]
This number is comparable to the 2015 Tianjin explosion (0.3 kilo tonnes of TNT).