Hey Abraham,
Plots are very useful for visualizing the behavior of functions.
ClearAll@f;
f[x_] := Piecewise[{{x^3, -4 <= x <= 1}, {3 x, x > 1}}]
d[x_] := Limit[(f[x + h] - f[x])/h, h -> 0]

Plot[{f[x], Evaluate@d[x]}, {x, 0, 2},
 PlotLabels -> "Expressions",
 ImageSize -> Large]
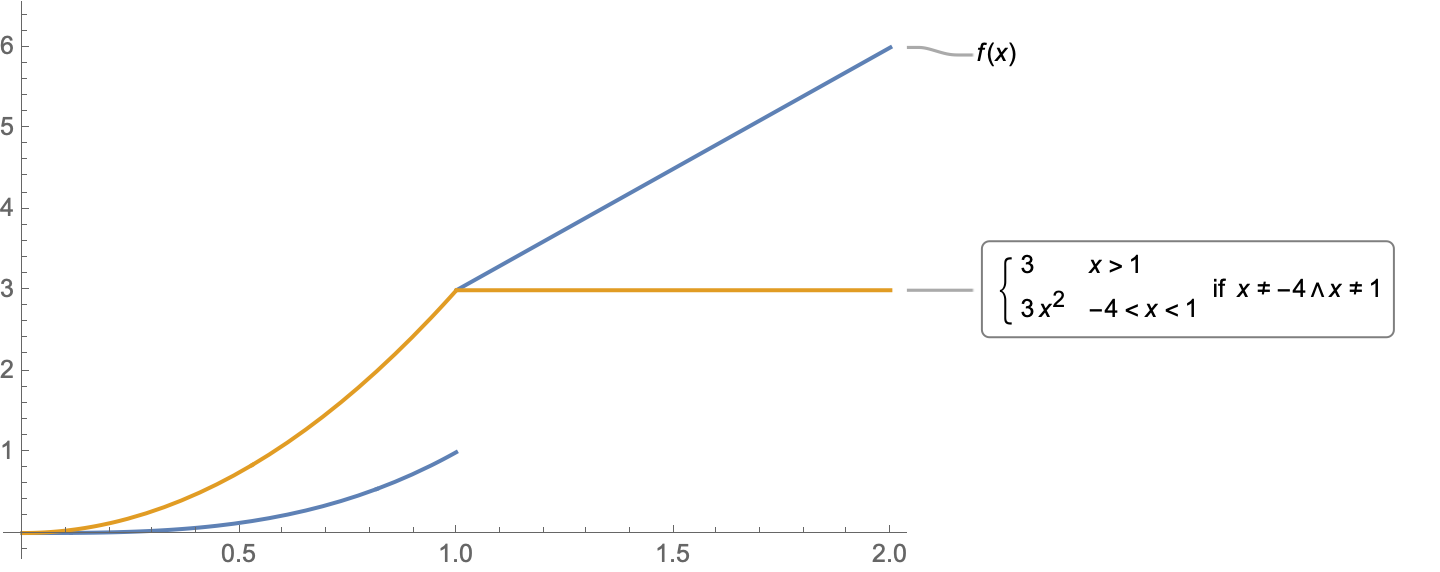
Note that d[x] is a ConditionalExpression that is not defined at x = 1 and x = -4
d[1]
(* Indeterminate *)
Or
Limit[(f[x + h] - f[x])/h, h -> 0] /. x -> 1
(* Undefined *)
Verify
f'[1]
(* Indeterminate] *)


