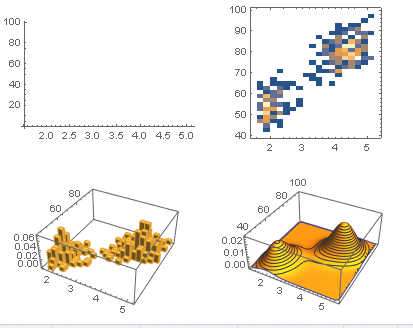
Hi! I am trying to reproduce a GraphicsGrid to visualize data as follows:
ofdata = ExampleData[{"Statistics", "OldFaithful"}];
GraphicsGrid[{
  {ListPlot[ofdata], DensityHistogram[ofdata, 20, "PDF"]},
  {Histogram3D[ofdata, 20, "PDF"], SmoothHistogram3D[ofdata]}
  }, ImageSize -> 400]
But the result was not the expected since the first ListPlot graphic was not shown (see figure below)
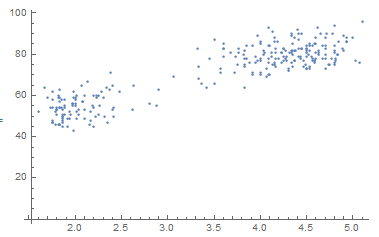
If I make the ListPlot isolated I success
ListPlot[ofdata]
I have Mathematica Version 12.1.1. I don't know why this happens, is this a bug?.
Thanks for your comments!


