Message Boards Message Boards

0
|
3463 Views
|
6 Replies
|
1 Total Likes
View groups...
Share
Share this post:

Question about computing period of a function

Posted 3 years ago

Hello there! I'm stuck at how to calculate the period of a function in Mathematica. enter image description here 
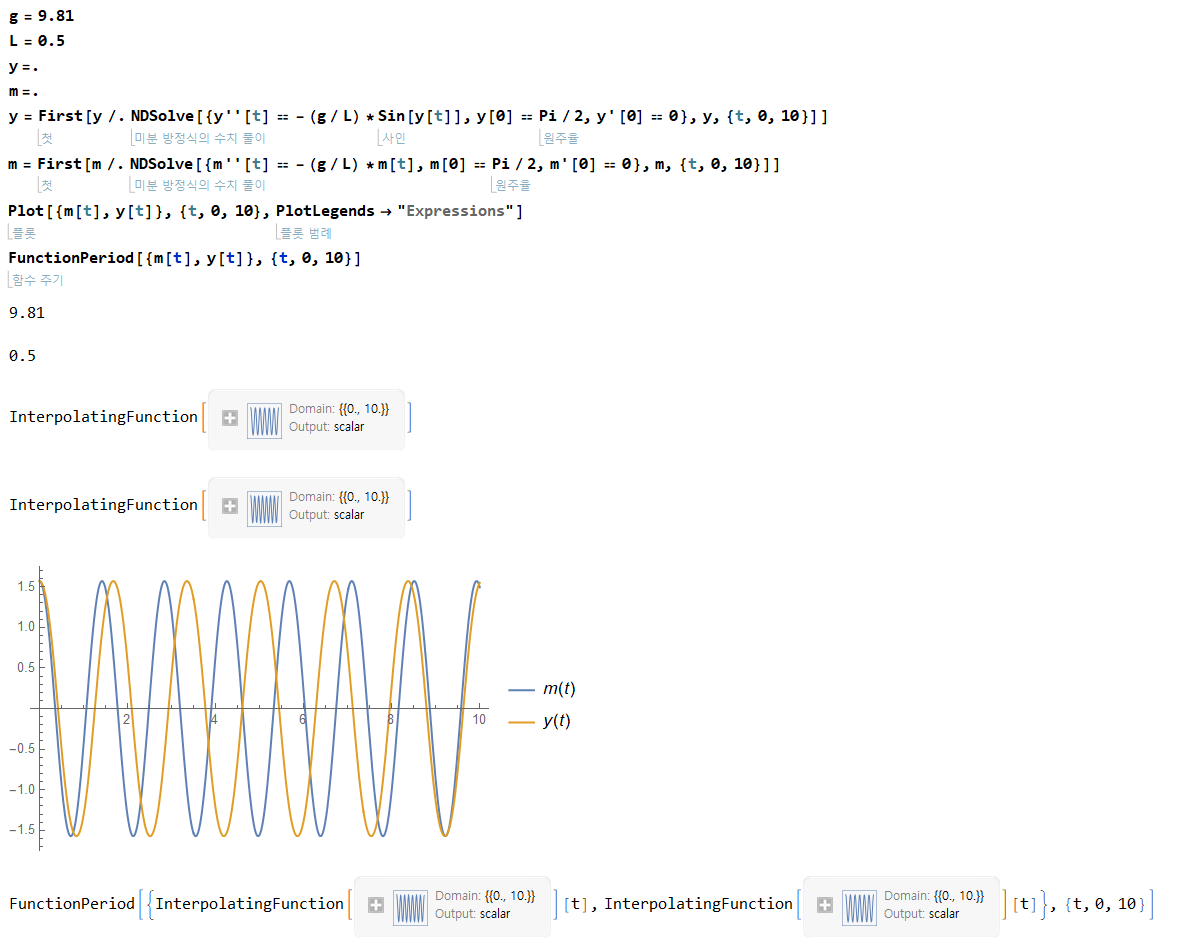
y[t] and m[t] are functions I made from different differential equations, and they should be periodic function. But I am not sure how to get the period. Also, I want to know how to compute x intercepts of my graphs, as in that way I can calculate the period as well.

Thank you so much.

edit: this is my code.

g = 9.81
L = 0.5
y =.
m =.
y = First[
  y /. NDSolve[{y''[t] == -(g/L)*Sin[y[t]], y[0] == Pi/2, y'[0] == 0},
     y, {t, 0, 10}]]
m = First[
  m /. NDSolve[{m''[t] == -(g/L)*m[t], m[0] == Pi/2, m'[0] == 0}, 
    m, {t, 0, 10}]]
Plot[{m[t], y[t]}, {t, 0, 10}, PlotLegends -> "Expressions",]
FunctionPeriod[{m[t], y[t]}, {t, 0, 10}]
POSTED BY: Ghunho Min
6 Replies

Oh wow, you are my savior, thank you so much. And it works for m(t) too! And I am getting expected answers! But I'd like to ask why the peak difference is not consistent and slightly varies every time. m(t) should be clearly trigonometric function, and its period should be consistent. And I am sure y(t) should also have consistent period. could you explain me the reason why there's small difference between each peak y values? Thank you! I really appreciate your help.

POSTED BY: Ghunho Min

Some responses to a very similar question appear at this Mathematica StackExchange thread. They include location of successive peaks as one method.

As for inconsistent periods, sure, it is quite likely the two do not have commensurate periods (that is to say, their ratio is irrational).

POSTED BY: Daniel Lichtblau
Posted 3 years ago

Hi Ghunho,

For m there is an analytic solution so we can get an exact answer using DSolve.

g = Rationalize@9.81; L = Rationalize@0.5; y =.; m =.;

solm = DSolve[{m''[t] == -(g/L)*m[t], m[0] == Pi/2, m'[0] == 0},  m, {t, 0, 10}]
fm = solm[[1, 1, 2]]
(* Function[{t}, 1/2 π Cos[3/5 Sqrt[109/2] t]] *)

FunctionPeriod[fm[t], t]
(* 10/3 Sqrt[2/109] π *)

N@%
(* 1.4185 *)

The numerical solutions will always have some variability due to the precision of the computations.You can control those in WL to arrive at a more precise computation of the period. For NDSolve you can try increasing AccuracyGoal and PrecisionGoal. For Plot you can try increasing PlotPoints.

POSTED BY: Rohit Namjoshi
Posted 3 years ago

Hi Ghunho,

Here is one rather inelegant way. The idea is to use the data from the plot to identify the peaks and use their location to get the period.

g = 9.81; L = 0.5; y =.; m =.;
soly = NDSolve[{y''[t] == -(g/L)*Sin[y[t]], y[0] == Pi/2, y'[0] == 0},y, {t, 0, 10}]
y = y /. soly // First

py = Plot[y[t], {t, 0, 10}, PlotLegends -> "Expressions"]

points = py // Cases[#, Line[x_] :> x, All] & // First;
yValues = points[[All, 2]];

yPeaks = FindPeaks[yValues]
yPeakIndexes = yPeaks[[All, 1]]

Table[points[[i, 1]], {i, yPeakIndexes}] // Differences
(* {1.67438, 1.6757, 1.67197, 1.6763, 1.67339, 1.62825} *)

The peaks are separated by ~1.67. Try the above procedure on m.

POSTED BY: Rohit Namjoshi
Posted 3 years ago

Hi Ghunho,

Please post code, not images, so those who are trying to help can copy/paste the code rather than having to reproduce it from an image.

POSTED BY: Rohit Namjoshi

ok thanks

POSTED BY: Ghunho Min
Reply to this discussion
Community posts can be styled and formatted using the Markdown syntax.
Reply Preview
Attachments
Remove
or Discard

Group Abstract Group Abstract