Message Boards Message Boards

0
|
2907 Views
|
4 Replies
|
0 Total Likes
View groups...
Share
Share this post:

Re-scaling of vertical axis for a 2D plot?

Posted 3 years ago

I'm trying to do re-scaling of the vertical axis i.e. the y-axis of a 2D plot so as to remove the 10^29 and 10^27 terms as visible in my plot and convert the scale into a perfect linear scale.

But surprisingly, the code does not accept the re-scaling factor.

I need the re-scaling factor which exactly re-scale the vertical axis.

POSTED BY: Rahul Chakrabory
4 Replies
Posted 3 years ago

Don't see 10^29 or 10^27 in the attached notebook plots so it is not at all clear what you are trying to accomplish. What is a "perfect linear scale"?

POSTED BY: Rohit Namjoshi

The scaling factor I have as y=y*10^-29 reduced it to the 10^10 and 10^14 from its initial values as 10^27 and 10^29. But I want the terms 10^10 and 10^14 to vanish form plot 1 and plot 3, and the scales should look like that of plot 2.

POSTED BY: Rahul Chakrabory
Posted 3 years ago

A single scale factor cannot be used since the range of the plots is different. One way to do it e.g. for the first plot

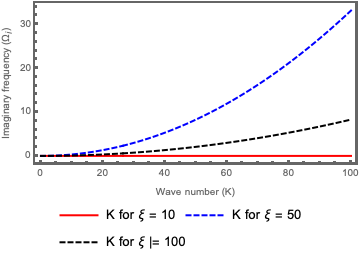
Plot[{Im[y] /. {xi -> 10}, Re[x] /. xi -> 50, Re[x] /. xi -> 100}, {k,0, 100},
 PlotRange -> All,
 PlotStyle -> {Directive[Red, Thick], Directive[Blue, Dashed, Thick], Directive[Black, Thick, Dashed]},
 Frame -> True,
 FrameStyle -> Thick,
 PlotLegends -> {"K for \[Xi] = 10", "K for \[Xi] = 50", "K for \[Xi] |= 100"}, 
 FrameLabel -> {"Wave number (K)", "Imaginary frequency (\!\(\*SubscriptBox[\(\[CapitalOmega]\), \ \(i\)]\))"},
 RotateLabel -> True,
 AspectRatio -> 0.5,
 FrameTicks -> {{Charting`ScaledTicks[{10^9 # &, #/10^9 &}], None}, {Automatic, None}}]

enter image description here

POSTED BY: Rohit Namjoshi

It's working. But I didn't understand how it's working.

POSTED BY: Rahul Chakrabory
Reply to this discussion
Community posts can be styled and formatted using the Markdown syntax.
Reply Preview
Attachments
Remove
or Discard

Group Abstract Group Abstract