Group Abstract Group Abstract

Message Boards Message Boards

0
|
4.1K Views
|
2 Replies
|
2 Total Likes
View groups...
Share
Share this post:

Same circles' radius when using Graphics

Posted 5 years ago

code:

Table[Graphics[Circle[{0, 0}, x]], {x, 1, 5}]

outcome: enter image description here

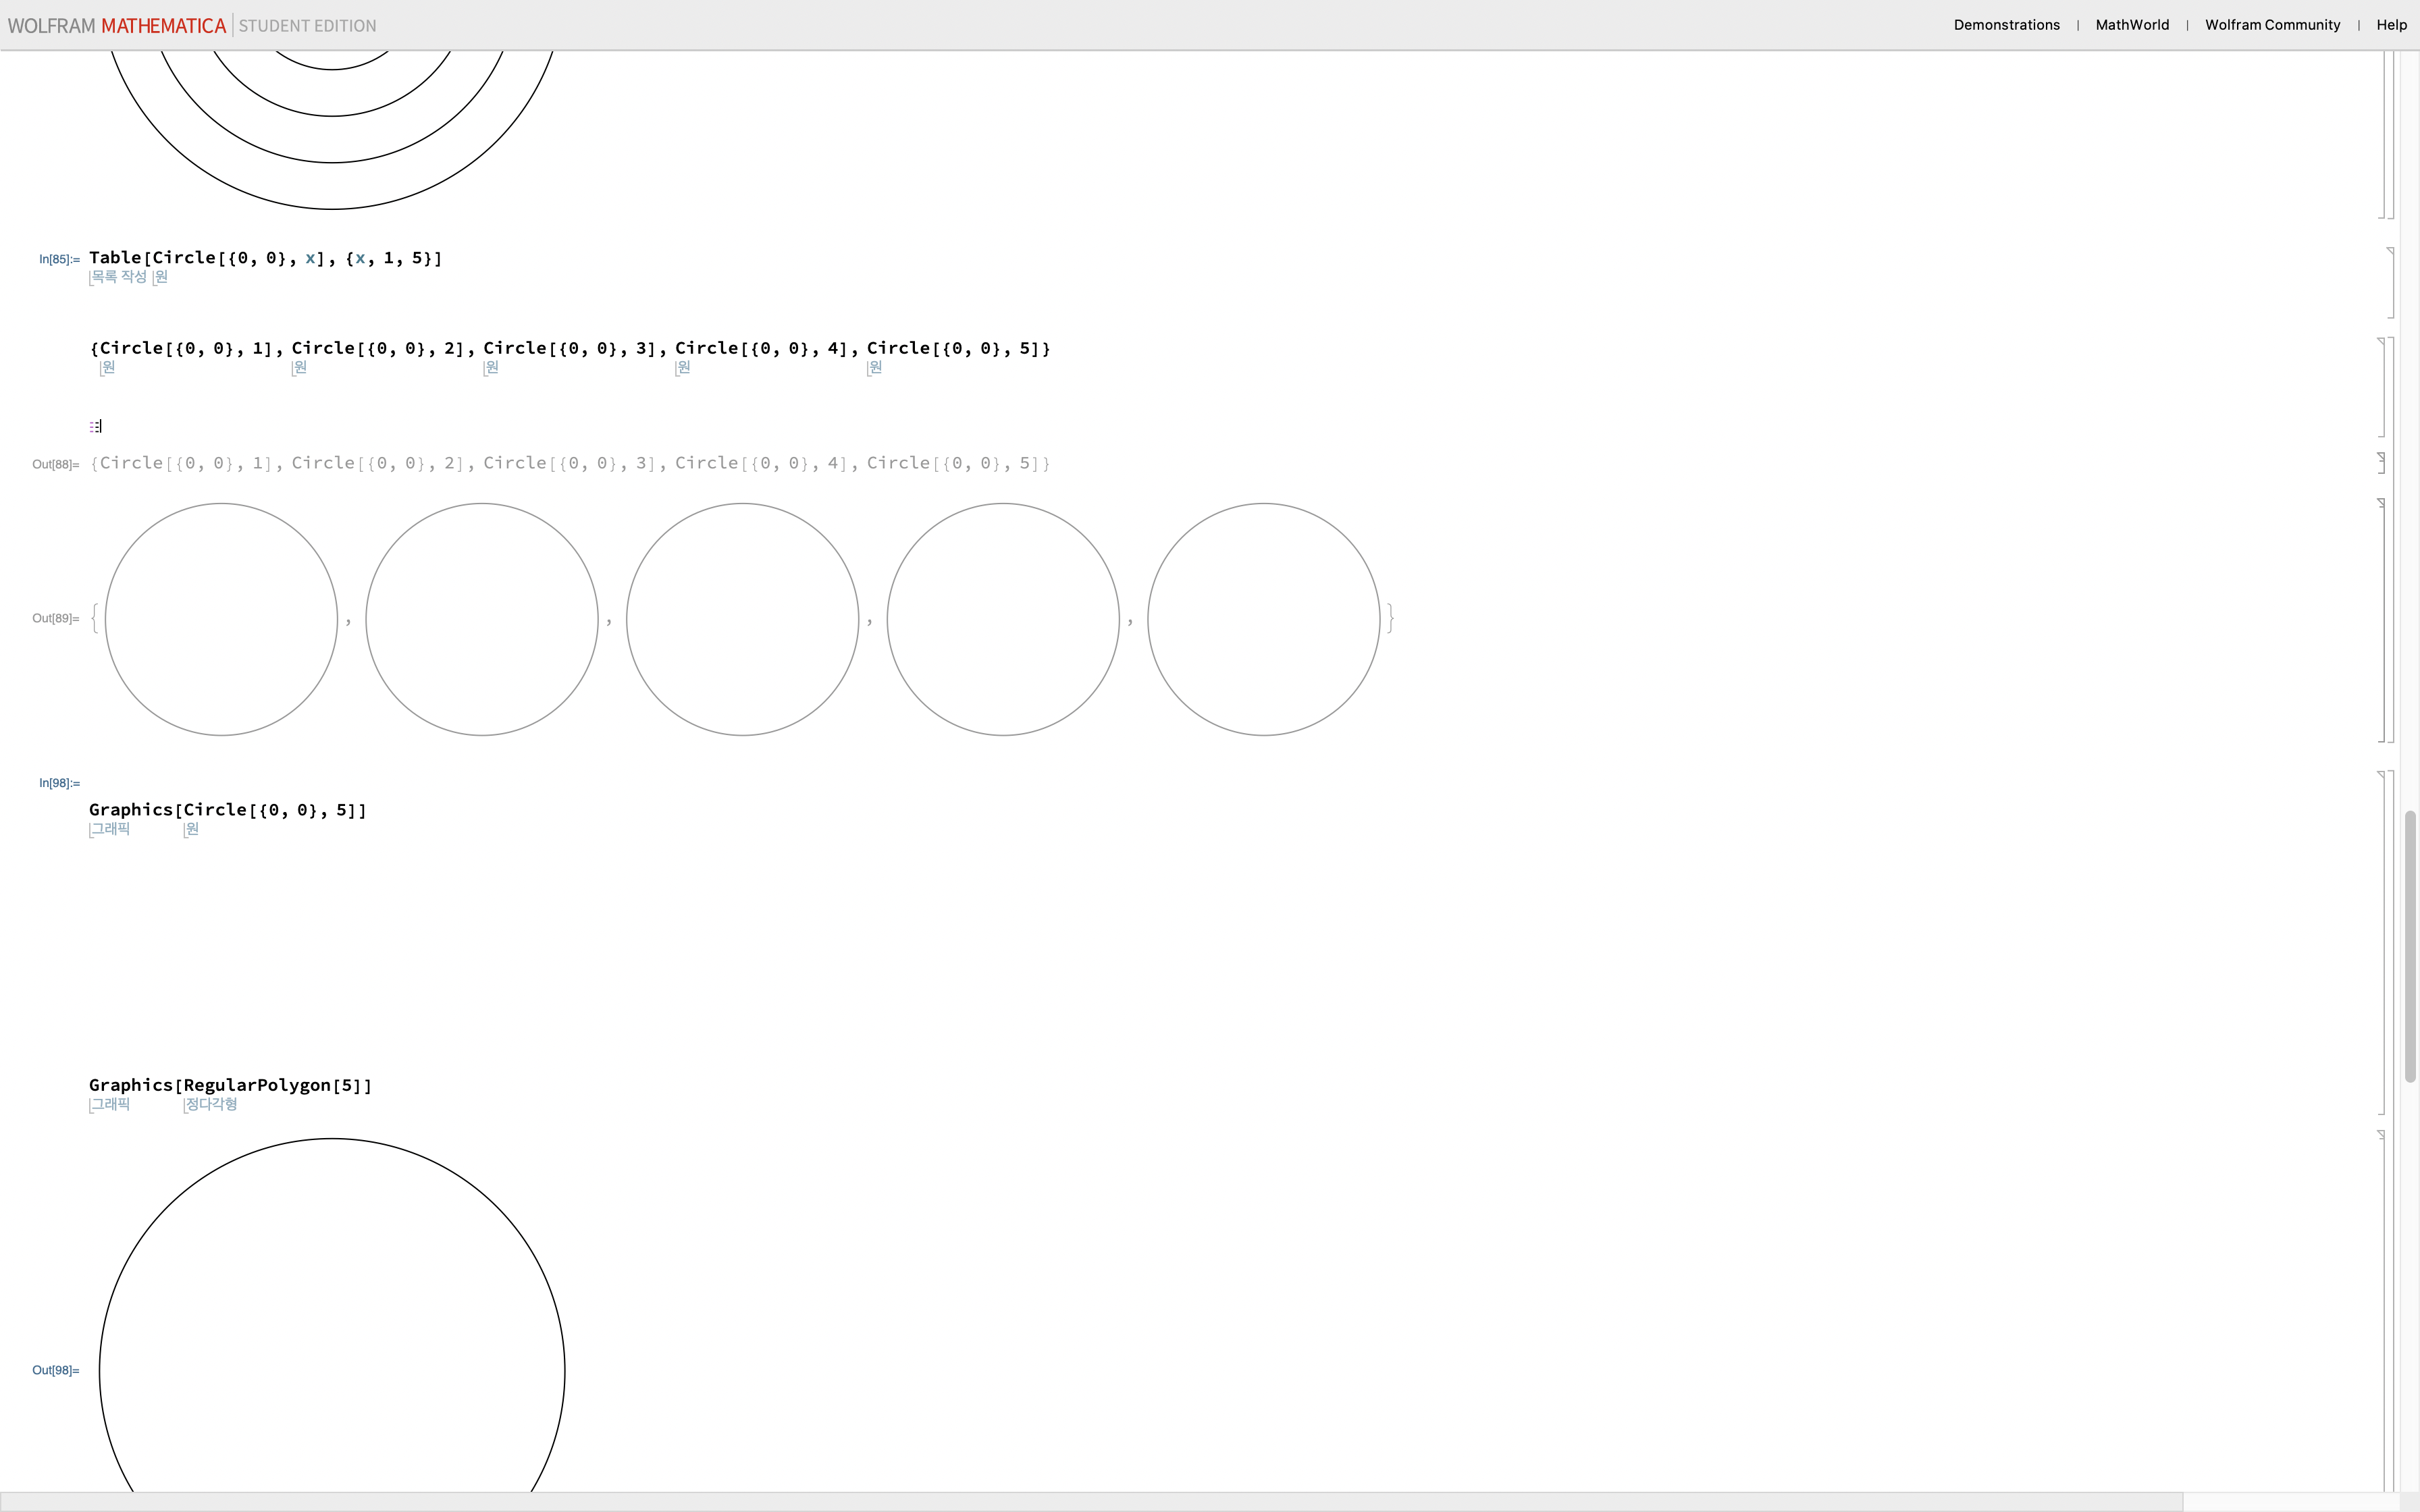
I want the outcome circles are different radius visually. already check using 'get coordinates', they are different radius on coordinate. (only date not visual) How to get the outcome circles are different radius visually. Thank you for your advice.

POSTED BY: chang hyeon lee
2 Replies
Posted 5 years ago

The same circle, but different radius in a line?

POSTED BY: Yasmin Hussain
Posted 5 years ago

Set PlotRange to be the same in the Graphics.

Table[Graphics[Circle[{0, 0}, x], PlotRange -> 6], {x, 1, 5}]
POSTED BY: Hans Milton
Reply to this discussion
Community posts can be styled and formatted using the Markdown syntax.
Reply Preview
Attachments
Remove
or Discard