Hi Rahul,
Using Epilog for the axis labels is not a good idea. The labels do not follow the axes as the plot is rotated. Use AxesLabel instead.
AxesLabel -> (Style[#, 14, Black, Bold] & /@ {"\[Xi]", "K", "\!\(\*SubscriptBox[\(\[CapitalOmega]\), \(r\)]\)"})
To make the plot legend bold
PlotLegends -> {Style["Real frequency", Bold]}
To change the tick style
TicksStyle -> Directive[Bold, Black]
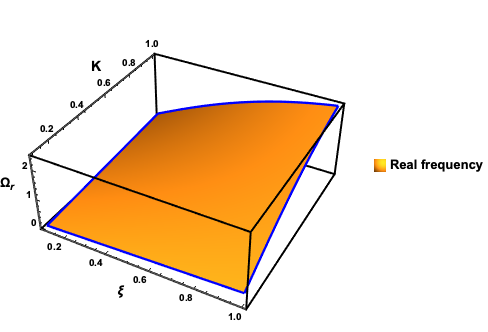
Result
Plot3D[Re[x], {xi, 0.1, 1}, {k, 0.1, 1},
 BoundaryStyle -> Directive[Blue, Thickness[0.007]],
 PlotLegends -> {Style["Real frequency", Bold]},
 AxesLabel -> (Style[#, Black, 14, Bold] & /@ {"\[Xi]", "K",
     "\!\(\*SubscriptBox[\(\[CapitalOmega]\), \(r\)]\)"}),
 Mesh -> {{0}},
 BoxRatios -> {1, 1, 0.4},
 BoxStyle -> Directive[Black, Thickness@0.006],
 TicksStyle -> Directive[Bold, Black]]