Hello, I need help with 2D plotting (discrete points are fine). I will be plotting using “Dates” as the abscissa (ref/DateListPlot). For the ordinate I want to use Alpha-Numeric characters, for example “bridge1”, “bridge-J”….These would not have incremental changes like A1, A2, A3....Ai.
How do I get the ordinate to have A-N characters?
Thanks very much
Andrew
I'm sure to learn something on Wolfram. They do give something few people can't search for.
Hello Rohit, Thanks very much for these solutions, they are what I am looking for. I will use the second example. This helps be in learning how to use Wolfram Math.
Thanks again!
Hello Rohit, I've attached a Power Point graphic example showing what I am looking for. However, I will save your comment in my W. Note Book programming summary sheet.
Thanks very much for your fast response. Andrew
Hi Andrew,
Thanks for the visual. I think TimelinePlot is more like what you are looking for. See attached file. It may be possible to get a plot closer to what you are looking for using DateListPlot with custom FrameTicks, but I need to experiment to figure out how to do it.
DateListPlot
FrameTicks
Turned out to be quite easy to do. See attached file.
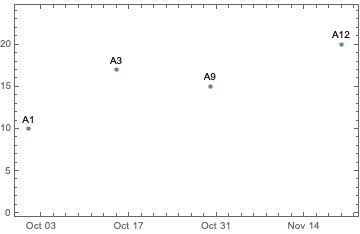
Do you mean something like this?
MapThread[Labeled[#1, #2, Above] &, {data, {"A1", "A3", "A9", "A12"}}] //
  DateListPlot[#, Joined -> False] &