Hi guys,
the 1st step of my math model is combine model curve with experimental curve for each of the conditions I had to test. For this I am using Show[Model, Experimental], like:
    ADJGrafico241 = Show[ListPlot[ADJdataModelTHEO241,
PlotLegends -> {"24h_1%_MOD"},PlotStyle -> {Blue, Dashed}], CurvaExp241]
It is perfect, showing one curve over the other.
But I have to do this 3 times, like ADJGrafico241, ADJGrafico242, ADJGrafico243. After ploting 3-Show-OverlapingCurves-Graphics, I wanna to present then one aside the other. For that, I am doing:
GraphicsRow[ADJGrafico241, ADJGrafico242, ADJGrafico243]
And I think it is not working because the output is: 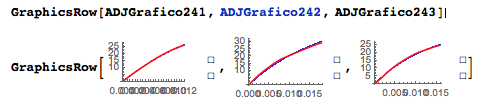
Can I combine those? Because I really need to have a graphic with one curve overlapping the other. And to better visualize the 3 graphics I thought to put one in the side of the other.
A appreciate your help and time.


