Message Boards Message Boards

3d Compare past and future generations of the Wolfram models

Posted 3 years ago

View this post in Wolfram Cloud Notebook format

Viewing events in 3d on node level to compare the past and future generations of the Wolfram models

We created a new feature to the gigabrain.io physics 3d explorer. It features a comparison between final generations of the current, previous and future generation

Wolfram model 6721 progress
Video animation of 6721 progress in 50 generations
Click to see model 6721 generation 8 comparison in 3d

Wolfram model 44586 progress
Video animation of 44586 progress in 100 generations
Click to see model 44586 generation 1 comparison in 3d

Color code explanations in the 3d viewer of the generation comparison

The 3d viewer's node colors are coded as following:

  • Red = Node is found only in previous generation
  • Light red = Node is found in previous and current but not the next generation
  • Blue Magenta = Node is found in all 3 previous, current and next generation
  • Light green = Node is found in current and next but not the previous generation
  • Green = Node is found only in next generation

Wolfram model final states as image list

Below is a comparison of the event states in Wolfram SetReplace project. Here we use the Wolfram Model wm3147.

Let's compare the images with the final states using the StatesPlotsList.

ResourceFunction["WolframModel"][{{{1, 1, 2}, {3, 4, 5}} -> {{3, 3, 6}, {1, 3, 2}, {7, 1, 3}, {7, 8, 2}}}, {{1, 1, 1}, {1, 1, 1}}, 4 ][ "StatesPlotsList",VertexLabels -> Automatic,  ImageSize -> 100]

Generations output

Comparing generations in 3d viewer

Click to See model 3147 generation 3 comparison in 3d viewer

To compare the generation 3 with the 3d viewer we can use the link below and we get the image below. In the user interface you can change the mode by clicking on the mode button. Default mode is for a single graph the next mode is the generation comparison and the third mode is to download the graph as a OBJ 3d file. 3d Generation comparison

In this graph the Current generation is 3 and previous is 2 and next is 4. For reference the generations are below. Magenta Nodes 1, 2 and 3 are found in generations 2, 3 and 4. Light red Node 4 is not in the generation 4 but can be found in 3 and 2. Light green Nodes 5, 6 and 7 are created in current generation and also present in next generation. Green Nodes 8, 9, 10, 11, 12 and 13 are found only in generation 4.

Generations 2 3 4

Click to See model 3147 generation 4 comparison in 3d viewer

When changing the view to the next generation 4 we get the image below. 3d Generation comparison 2

In this graph the current generation is 4 and previous is 3 and next is 5 . For reference the generations are below. Magenta Nodes 1, 2, 3, 5, 6 are found in generations 3, 4 and 5. Light red Node 7 is not in the generation 5 but can be found in 4 and 3. Light green Nodes 8,9,10,11,12,13 are created in current generation 4 and also present in next generation 5. Green Nodes 14,15,16,17,18,19 are found only in the next generation 5.

Generations 3 4 5

The final generation comparison does not take account the single events that produce the final states. We can see a full comparison of the events that produced the states with the EventsStatesPlotsList.

The documentation says about the graphs: Here the dotted gray edges are the ones about to be deleted, whereas the red ones have just been created.

ResourceFunction["WolframModel"][{{{1, 1, 2}, {3, 4, 5}} -> {{3, 3, 6}, {1, 3, 2}, {7, 1, 3}, {7, 8, 2}}}, {{1, 1, 1}, {1, 1, 1}}, 4 ][ "EventsStatesPlotsList",VertexLabels -> Automatic,  ImageSize -> 100]

Event states

Events to produce the generation 3. Nodes with red lines are created.

Event State 1

Events to produce the generation 4. Here we see the removal of the node 4 with two dotted gray lines.

Event State 2

Events to produce the generation 5. Here we see the removal of the node 7 with two dotted gray lines.

Event State 3

Conclusion

As a conclusion this shows that the comparison of the final generations can visually show in what areas the new nodes are created and in what areas the nodes are being deleted. But it does not show the full event graph of how the events are produced.

Problems

  • The viewer does not show events differently that have first removed a node and later on added the node again in the same generation. It only compares the differences of the final generations.
  • Currently the 3d viewer does not handle all types of Wolfram models, like single-element models wm161, model with multiple rules wm4486
  • The model calculation is done by Javascript and does not use Wolfram language. By the cause of this the rule choosing is not available in the 3d viewer and the resulting event numbering might differ.
  • We use the name Wolfram model as defined in SetReplace Project: "A more interesting case (which we call a Wolfram model) is one where the set elements are related to each other. Specifically, we can consider a set of ordered lists of atomic vertices; in other words, an ordered hypergraph. " Although the implementation is made currently with Javascript's own implementation and not the SetReplace package.

References

POSTED BY: Tuomas Sorakivi
2 Replies

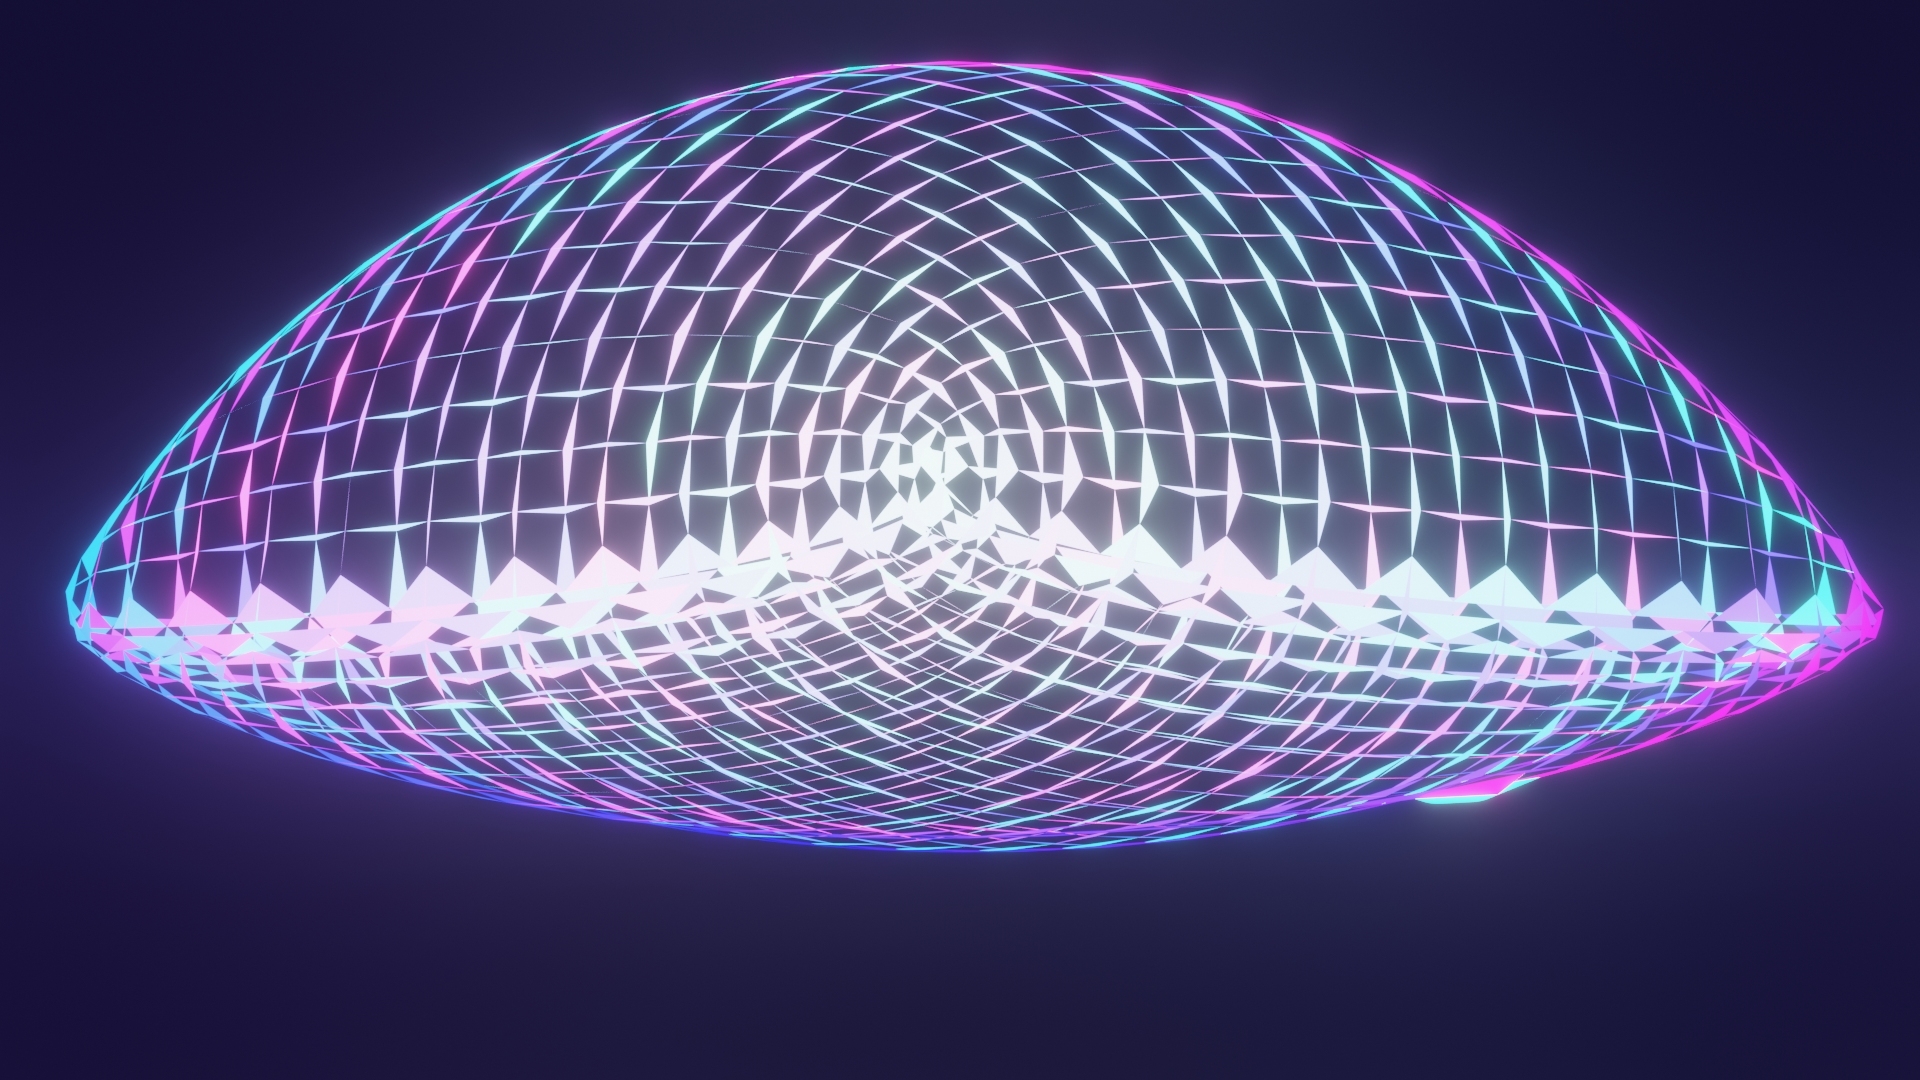
Added a new update video of the generation 1 - 100 progress in the "pillow" model 44586.

Wolfram model 44586

POSTED BY: Tuomas Sorakivi

Here is an example animation from the 50 first generations of model wm6721

Wolfram model 6721 progress

Video animation of 6721 progress in 50 generations

Click to see model 6721 generation 8 comparison in 3d

Best Tuomas

POSTED BY: Tuomas Sorakivi
Reply to this discussion
Community posts can be styled and formatted using the Markdown syntax.
Reply Preview
Attachments
Remove
or Discard

Group Abstract Group Abstract