Hello,
I'm trying to run a parametric plot of two functions I have defined earlier IOut and V. I am able to plot them individually with t on the x-axis but when I attempt a parametric plot it keeps being empty. How can I fix this?
Thanks in advance!
IRun[t] = IOut[v0, v1, v2, w, d, ic1, ic2, ic3, c1, c2, c3, c, extFlux1, extFlux1Freq, extFlux2, extFlux2Freq, t]
VRun[t] = V[v0, v1, v2, w, d, t]
MaxI = MaxValue[IRun[t], t]
MinI = MinValue[IRun[t], t]
MaxV = MaxValue[VRun[t], t]
MinV = MinValue[VRun[t], t]
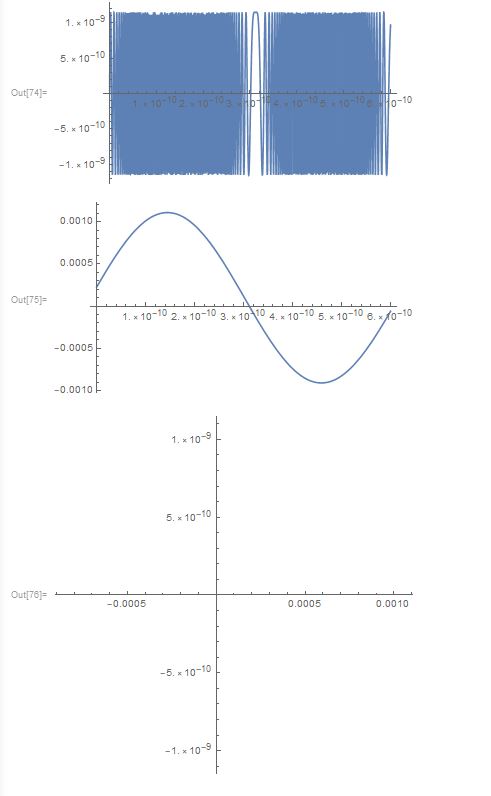
Plot[IRun[t], {t, 0, runTime}]
Plot[VRun[t], {t, 0, runTime}]
ParametricPlot[{VRun[t], IRun[t]}, {t, 0, runTime},
PlotRange -> {{MinV, MaxV}, {MinI, MaxI}}, AspectRatio -> 1]