Message Boards Message Boards

0
|
5599 Views
|
1 Reply
|
0 Total Likes
View groups...
Share
Share this post:

Manipulate RadioButton Checkboxes Barchars

Posted 10 years ago
Hello All, 
I am new user and I am doing 1 project. 
In Manipulate, I need to show on the right my graphic (Kazakhstan map) and on the left 2 Radiobuttons and 5 checkboxes. first and second checkboxes belong to the first radiobutton and third, forth, fifth checkboxes belong to the second radiobutton. And according these check boxes which will be selected there should be barchars in my graphic in each region. 

Information needs to be taken from Excel file.

Could you please help me to import data from Excel and visualize data into graph(map) by region.

Thank you in advance.
Attachments:
POSTED BY: Guldana Taganova
First of all your description of needed interface is very confusing. You should try building interface yourself and if you run into a trouble - post the code and ask how to overcome a specific problem. Otherwise people have no idea what you are asking about - this is why no response after 8 days already.

Second, in the future you do not need polygonal data for Kazakhstan, you will be able to do it simply as this:
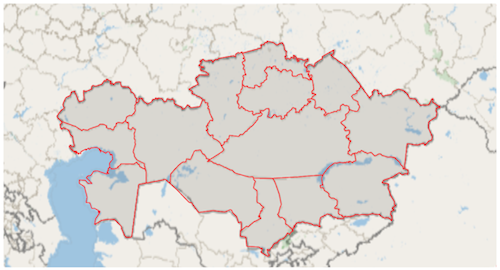
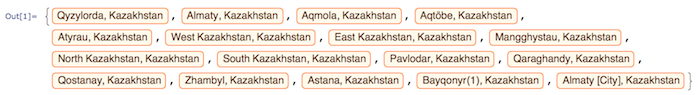
divisions = EntityValue[Entity["AdministrativeDivision", {_, "Kazakhstan"}], "Entities"]


GeoGraphics[{EdgeForm[Red], Opacity[0.1], Polygon[divisions]}]

POSTED BY: Sam Carrettie
Reply to this discussion
Community posts can be styled and formatted using the Markdown syntax.
Reply Preview
Attachments
Remove
or Discard

Group Abstract Group Abstract