The function I have to plot is (I wrote beta as k, check the image attached)
*dy/dz = -kb/Pi * cot(Piy/b)tan(kz)**
So first I set the y[z] as y[t] for ease, but actually I have to use constants b & k.
DSolve[{y'[t] == (-1/Pi)*Cot[Pi*y[t]]*Tan[1/(2*t)]}, y[t], t]
Then I set the plot as,
Plot[y[t], {y,0,1}, {t,0,2*Pi}]
But seems that it doesn't work.
Below picture is the graph I have to plot. There are boundaries.
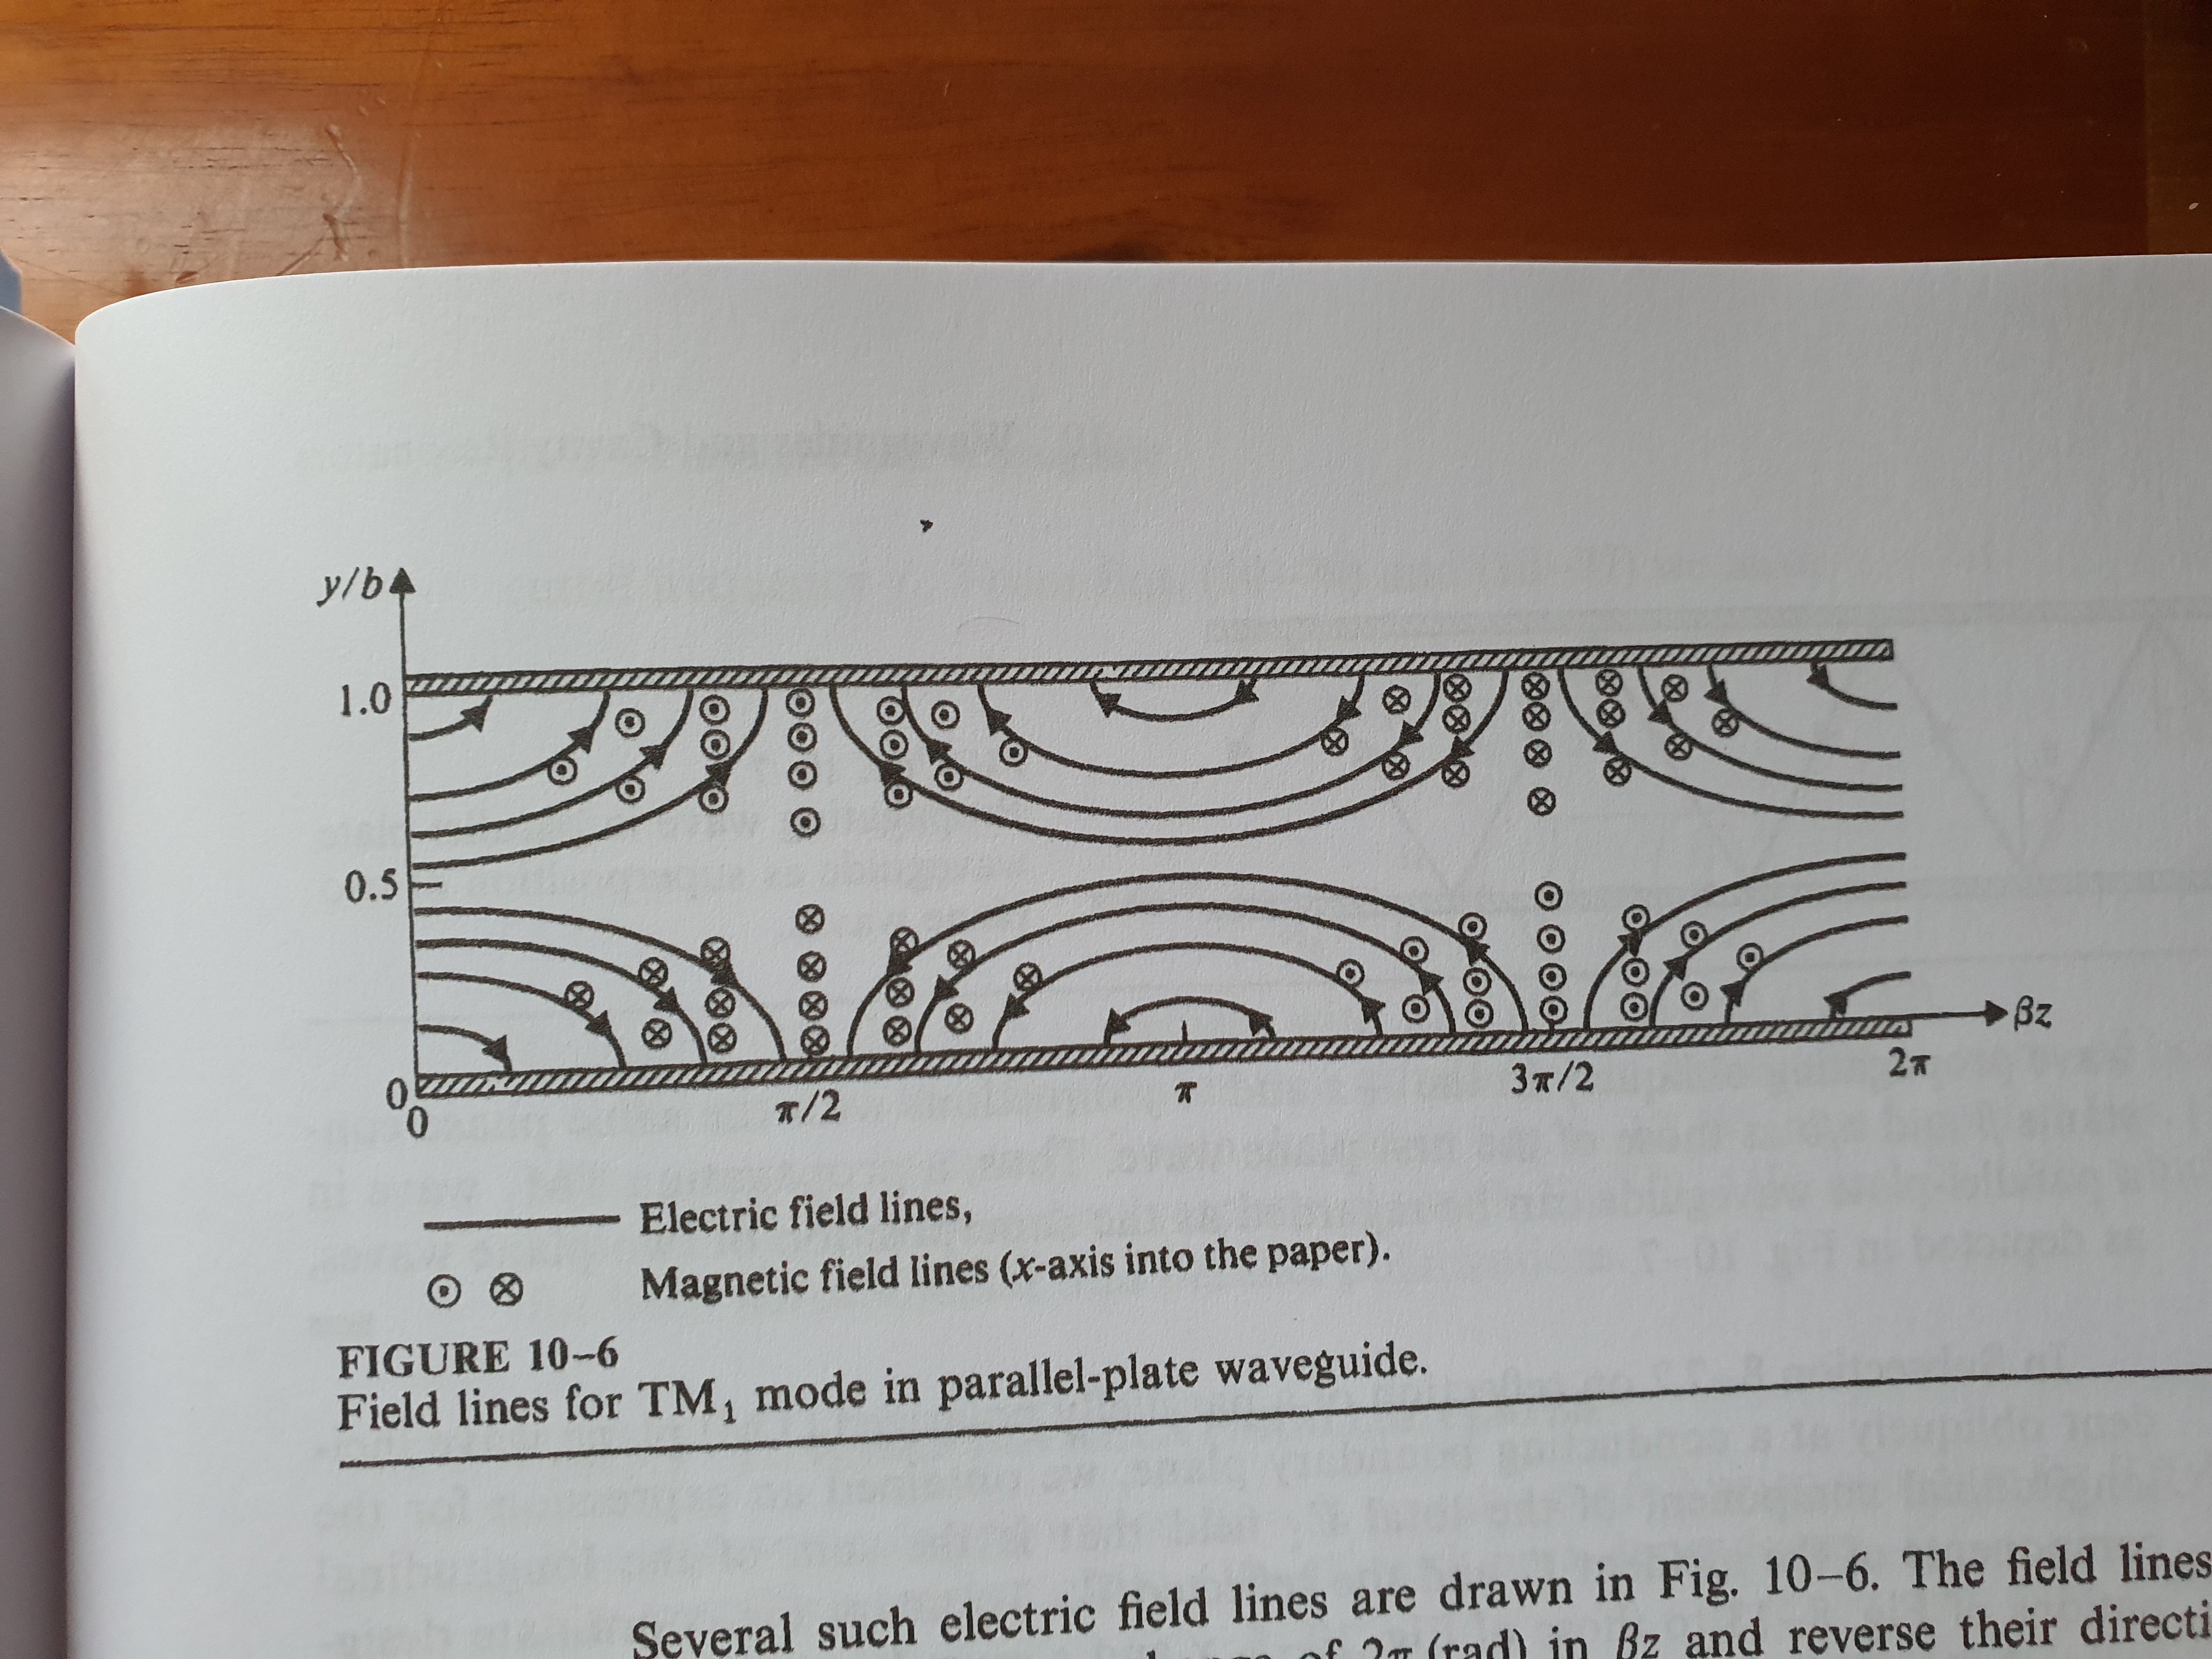
Could I get any advice to make a plot for kz, y/b?
Thanks!


