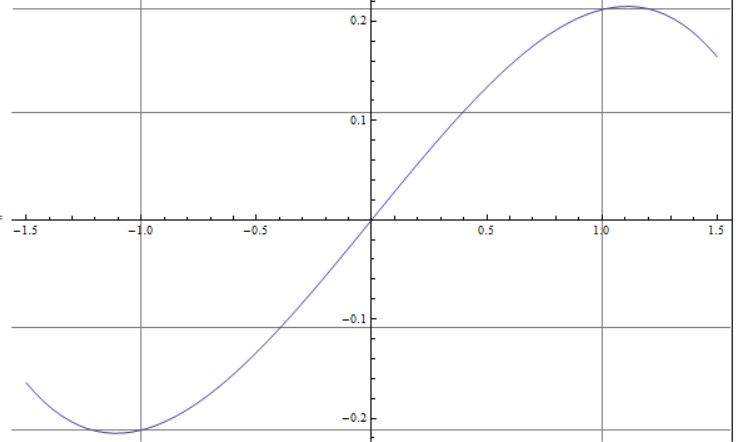
I am studying the Riemann zeta function, and I've created this cool graph which for a given Re(s) in the critical strip, it generates a graph of values given by a certain function, y=f(x).
When the graph crosses a certain line (y=2 x), that point represents a zero of the zeta function. Anyway, I'm not gonna give many details because this is a preliminary paper, a work in progress, and I don't want to say things that are not proven yet.
But anyway, how do I add a line (y=2 x) to this plot? Thanks so much.
Here's my code (redacted):
 $MaxExtraPrecision = 500; Clear[t]; r = 3/4; x0 = -3/2; m = 3; l =
  Round[x0 + m, 1]; k = 80;
 f[t_] :=redacted; s =
  Table[{n = x0 + m (q - 1)/(k - 1), f[n]}, {q, 1, k}]; g2 =
  ListPlot[s, Joined -> True, ImageSize -> Large,
   PlotStyle -> {Thickness[Tiny]},
   GridLines -> {Table[i, {i, -l, l}], Table[f[i], {i, -l, l}]}]
Please let me know where in this code I need to add the line, and more importantly how. Thanks so much!