MODERATOR NOTE: coronavirus resources & updates: https://wolfr.am/coronavirus

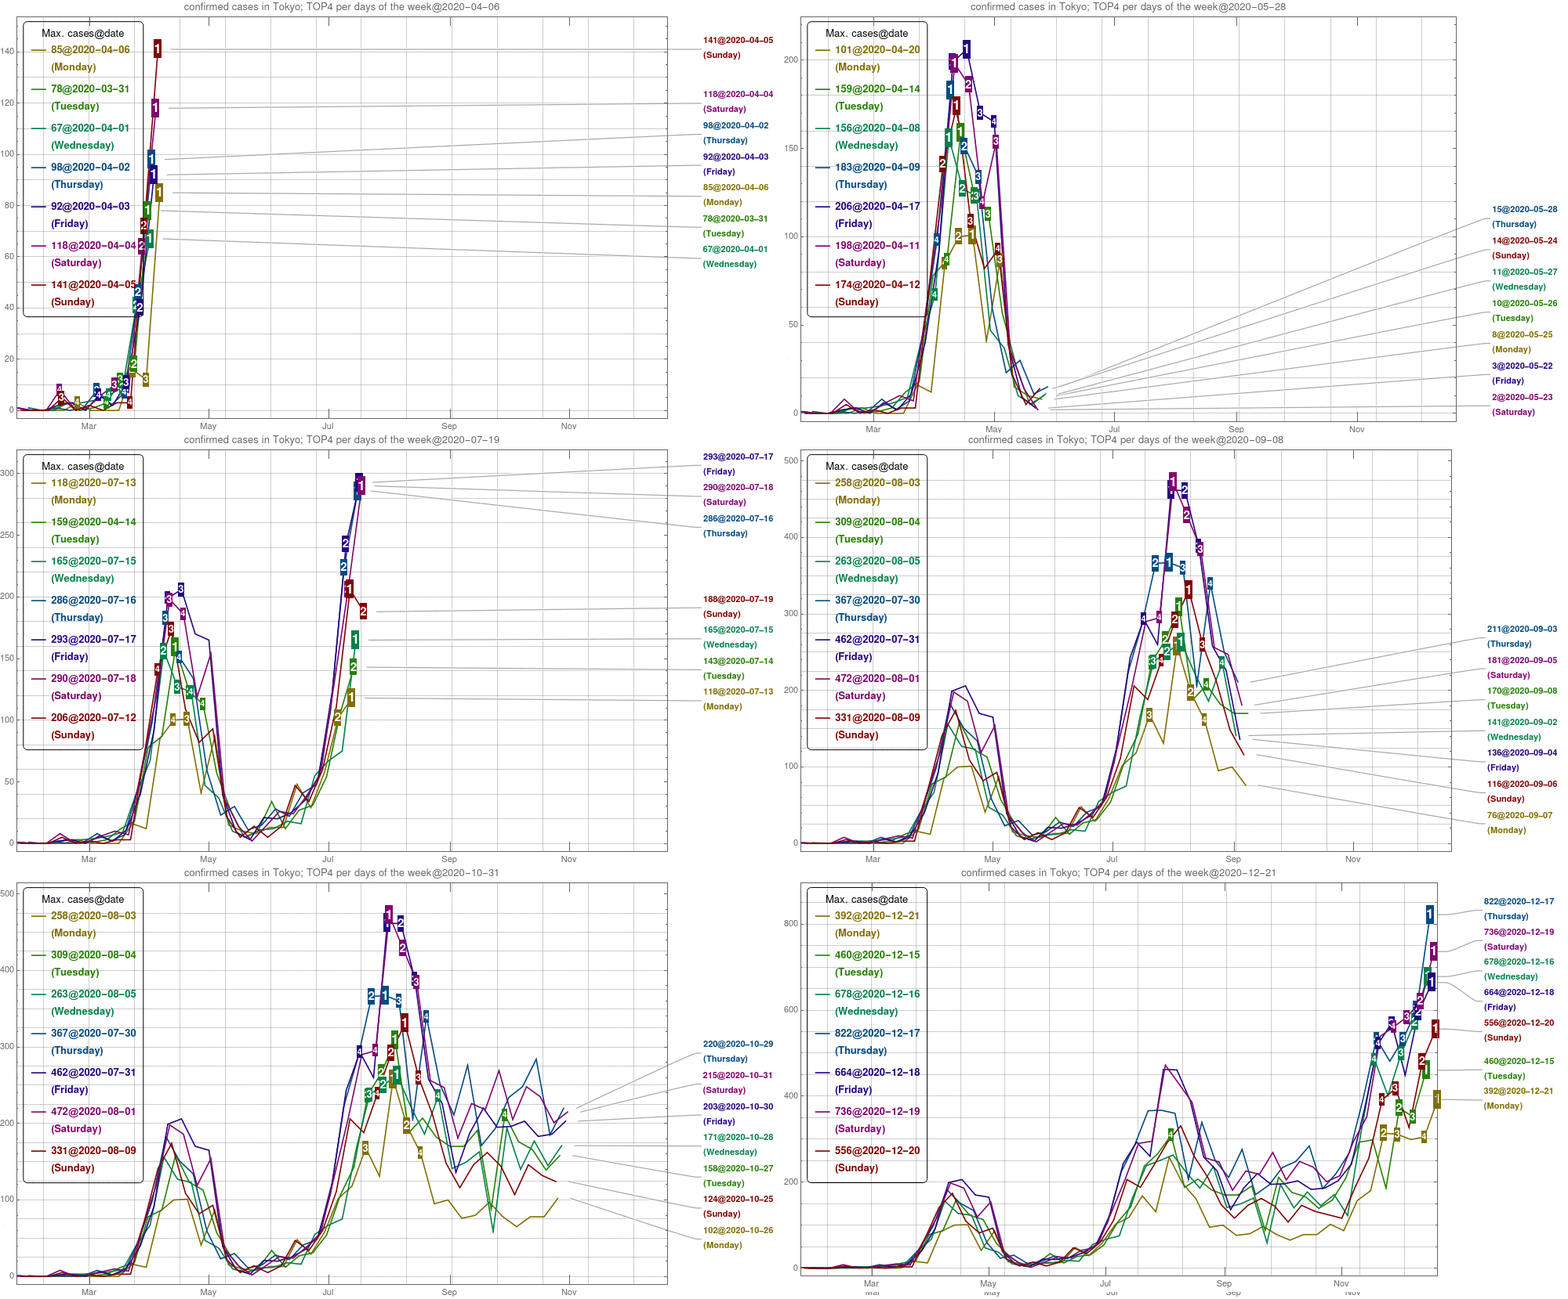
Seven curves represent number of confirmed COVID-19 cases in each day of the week through the year 2020, with top 4 points highlighted on each curve
(In Japanese)??????????????????????????????????????????????????????????????????????