Between
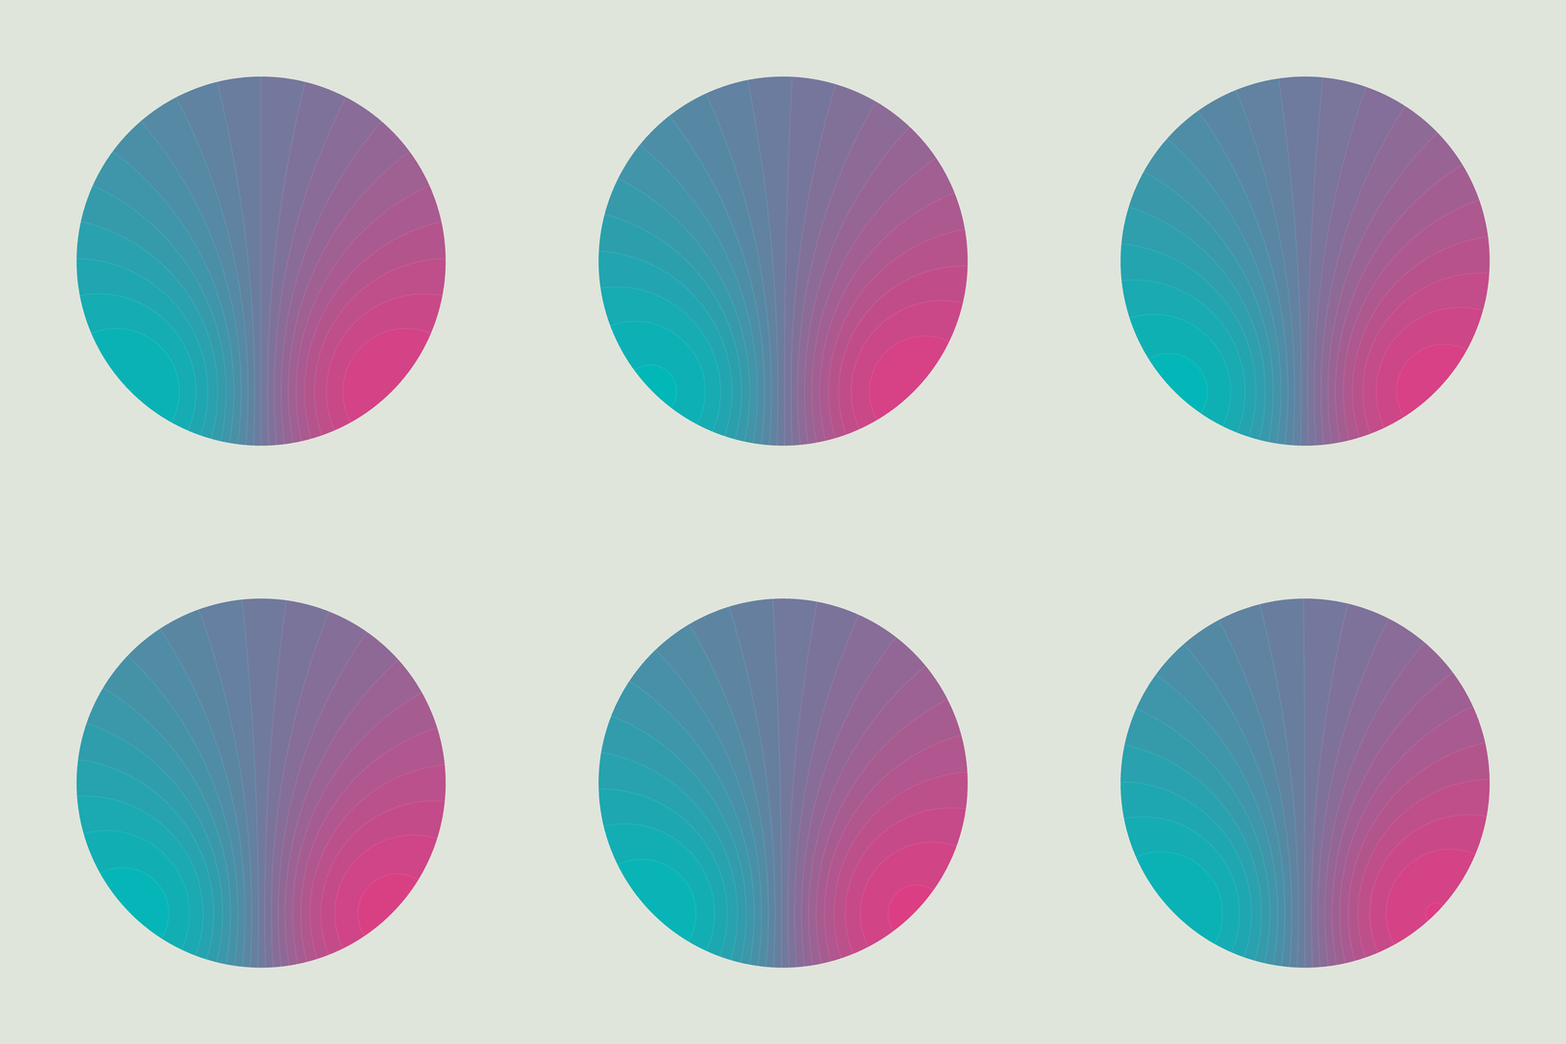
This shows east/west (rather than north/south) circles of latitude under stereographic projection to the plane as the circles travel at constant velocity towards the west pole.
Of course, we need stereographic projection:
Stereo[p_] := p[[;; -2]]/(1 - p[[-1]]);
And here's a Manipulate version of the GIF:
DynamicModule[{t = Sqrt[2], c, th = .002,
  cols = RGBColor /@ {"#00b8b8", "#de3d83", "#e0e5db"}},
 c = Sqrt[t^2 - 1];
 Manipulate[
  Graphics[{EdgeForm[Thickness[th]],
    Reverse[
     Table[{
       EdgeForm[Lighter[Blend[cols[[;; 2]], (r + s + 1)/2.1], .07]],
       Blend[cols[[;; 2]], (r + s + 1)/2.1],
       Polygon[
        Table[
         Stereo[{r + s, Sqrt[1 - (r + s)^2] Cos[\[Theta]], Sqrt[1 - (r + s)^2] Sin[\[Theta]]}],
         {\[Theta], -\[Pi], \[Pi], 2 \[Pi]/100}]]},
      {r, -1, -.1, .1}]
     ],
    Table[{
      EdgeForm[Lighter[Blend[cols[[;; 2]], (r + s + 1.1)/2.1], .07]],
      Blend[cols[[;; 2]], (r + s + 1.1)/2.1],
      Polygon[
       Table[
        Stereo[{r + s, Sqrt[1 - (r + s)^2] Cos[\[Theta]], Sqrt[1 - (r + s)^2] Sin[\[Theta]]}],
        {\[Theta], -\[Pi], \[Pi], 2 \[Pi]/100}]]},
     {r, 0, .9, .1}],
    EdgeForm[None], cols[[-1]], Annulus[{0, c}, {t, 10 t}]},
   PlotRange -> {Sqrt[2] {-t, t}, Sqrt[2] {-t, t} + {c, c}},
   ImageSize -> 540, Background -> Blend[cols[[;; 2]], (s + 1)/2.1]],
  {s, .0001, .0999}]
 ]