Message Boards Message Boards

0
|
3752 Views
|
2 Replies
|
1 Total Likes
View groups...
Share
Share this post:

How to make graph axes cross at (0,0)?

Anonymous User
Anonymous User
Posted 3 years ago

It pisses me off that Mathematica doesn't use old school math standards when producing a graph.

Here it has put the graph upside-down, the negative $y$-values above the $x$-axis:

enter image description here

And here it changed the graph to make it look like anything but what I would be pleased to see (the axes don't cross at $(0,0)$: enter image description here

How do I fix this?

POSTED BY: Anonymous User
2 Replies

Hi Jose,
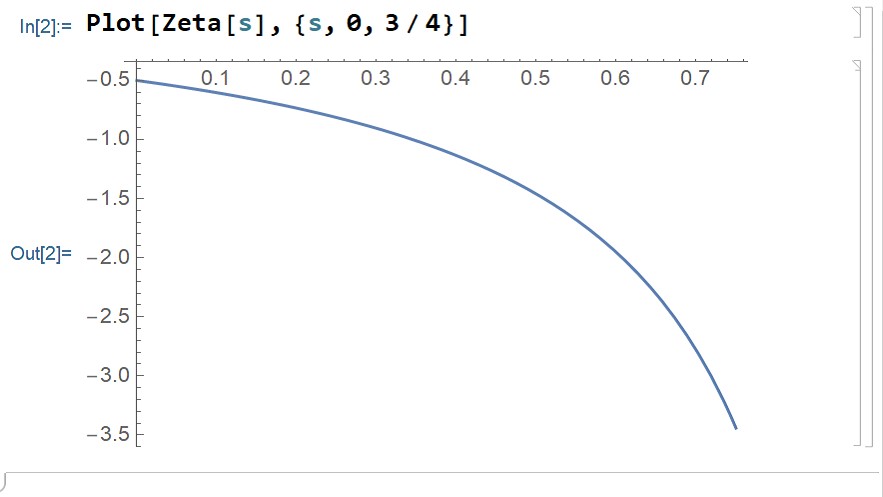
In the latest version uses the "old school math standards", but as Hans suggested, with the help of some options, you can alter that in your version.

enter image description here

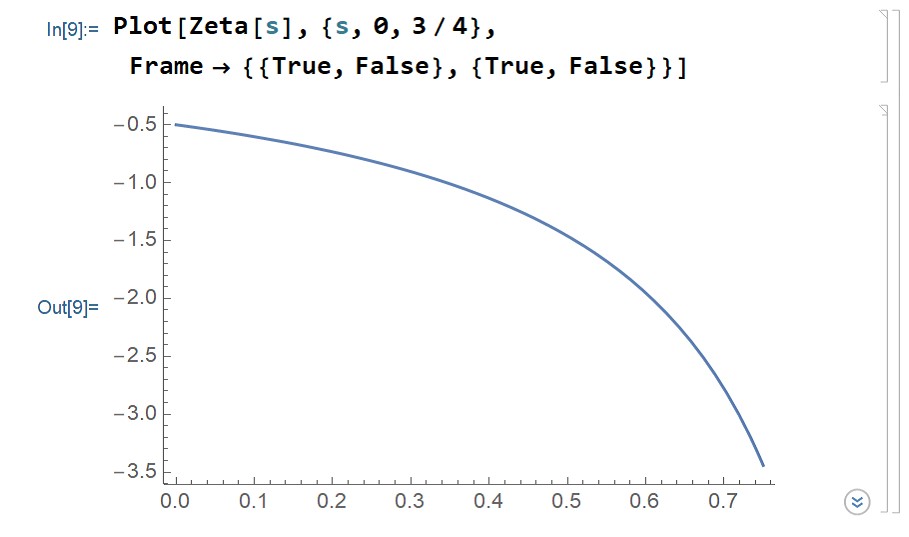
To be more specific, I was able to change the direction of the Y-axis using Frame

enter image description here

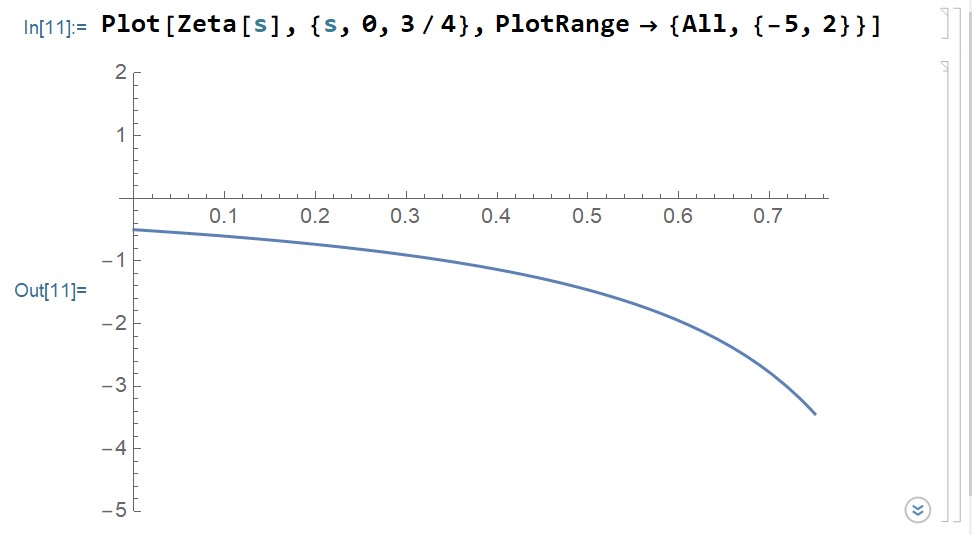
or you can simply use the option PlotRange to show some positive part on Y-Axis to force the plot to put the curve under X-Axis

enter image description here

POSTED BY: Ahmed Elbanna
Plot[Zeta[s],{s,5/4,2},AxesOrigin->{0,0},PlotRange->{{0,2},{0,5}}]
POSTED BY: Hans Dolhaine
Reply to this discussion
Community posts can be styled and formatted using the Markdown syntax.
Reply Preview
Attachments
Remove
or Discard

Group Abstract Group Abstract